What are Federally Qualified Health Centers (FQHCs)?
Federally Qualified Health Centers (FQHCs) in the United States are non-profit entities that are composed of clinical care providers, who operate at comprehensive federal standards. FQHCs were originally intended to provide the medically underserved population with quality care to minimize patient load in hospital emergency rooms.
According to Medicare and Medicaid statutes, FQHCs receive federal funding under Section 330 of the Public Health Service (PHS) Act to provide comprehensive primary care services to uninsured and underinsured populations thus ensuring that comprehensive care is available to all, regardless of income or insurance status. Medicare pays FQHCs based on the FQHC Prospective Payment System (PPS) for medically necessary primary health services and qualified preventive health services given by an FQHC practitioner.
To receive federal funding, FQHCs must meet the following requirements:
- Be located in a federally designated medically underserved area (MUA) or serve medically underserved populations (MUP)
- Provide comprehensive primary care
- Adjust charges for health services on a sliding fee schedule according to patient income
- Be governed by a community board of which a majority of members are patients at the FQHC
The Growth of FQHCs
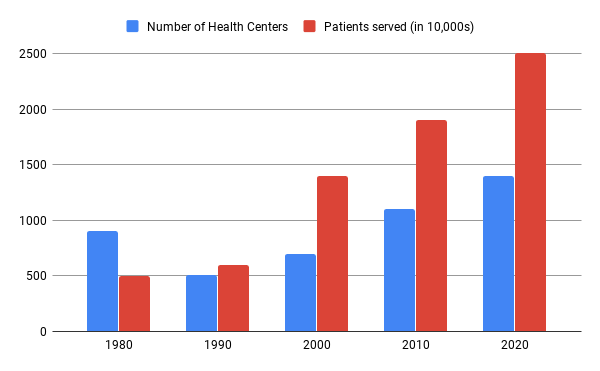
In the early 1960s, there were only 8 health centers in the U.S. Ever since then, the numbers have increased exponentially. By 2001, there were 748 health centers at 4,128 service sites around the nation, serving approximately 10 million individuals.
Federal funding for health centers has increased from $750 million in 1996 to $2.2 billion in 2010. Federal support has increased tremendously over the last 10 years. In 2011, there were 1,128 health centers providing care to more than 8,000 rural and urban delivery sites in the U.S. and territories. Today, there are 1,400 organizations with 11,200 facilities serving about 25 million individuals every year.
The above chart shows the growth of health centers from its inception in 1980 till 2020. The chart also shows the exponential increase in the number of patients served over the years.
FQHCs in various regions across the U.S
| State | State Code | Number of FQHCs |
| California | CA | 178 |
| Texas | TX | 73 |
| New York | NY | 70 |
| Florida | FL | 48 |
| Ohio | OH | 47 |
| Illinois | IL | 45 |
| Pennsylvania | PA | 44 |
| North Carolina | NC | 40 |
| Michigan | MI | 39 |
| Massachusetts | MA | 39 |
| Georgia | GA | 35 |
| Louisiana | LA | 36 |
| Oregon | OR | 33 |
| West Virginia | WV | 31 |
| Tennessee | TN | 30 |
| Alaska | AK | 28 |
| Missouri | MO | 28 |
| Washington | WA | 27 |
| Virginia | VA | 26 |
| Indiana | IN | 25 |
| Kentucky | KY | 23 |
| New Jersey | NJ | 23 |
| South Carolina | SC | 23 |
| Arizona | AZ | 21 |
| Mississippi | MS | 21 |
| Colorado | CO | 21 |
| Oklahoma | OK | 20 |
| Maine | ME | 20 |
| Kansas | KA | 18 |
| Maryland | MD | 17 |
| Montana | MT | 17 |
| New Mexico | NM | 17 |
| Wisconsin | WI | 18 |
| Connecticut | CT | 17 |
| Minnesota | MN | 16 |
| Alabama | AL | 15 |
| Hawaii | HI | 14 |
| Iowa | IA | 14 |
| Idaho | ID | 14 |
| Puerto Rico | PR | 14 |
| Utah | UT | 13 |
| Arkansas | AR | 12 |
| New Hampshire | NH | 11 |
| Vermont | VT | 11 |
| District of Columbia | WDC | 8 |
| Rhode Island | RI | 8 |
| Nebraska | NE | 7 |
| Nevada | NV | 7 |
| Wyoming | WY | 6 |
| South Dakota | SD | 5 |
| North Dakota | ND | 4 |
| Delaware | DE | 3 |
| Virgin Islands | VI | 3 |
| Guam | GU | 2 |
| Northern Mariana Islands | MP | 2 |
Performance of FQHCs

Figure 2 – Health Centers Perform Better on Ambulatory Care Quality Measures than Private Practice Physicians
The above chart shows how health centers have outperformed private practice physicians in every aspect of service.
The above chart shows a comparison between health centers and other providers based on the number of patient visits for various ailments.

Figure 4 – Health Center Patients Are More Satisfied with the Overall Care Received Compared with Low Income Patients Nationally
The above chart shows the level of satisfaction of low-income patients. Health center patients have a huge level of satisfaction as compared to other low-income patients nationally.
Financing and Reimbursements for FQHCs
FQHCs are required by law to provide services to all people, regardless of ability to pay. The uninsured are charged for services on a board-approved sliding-fee scale, which is based on a patient’s family income and size.
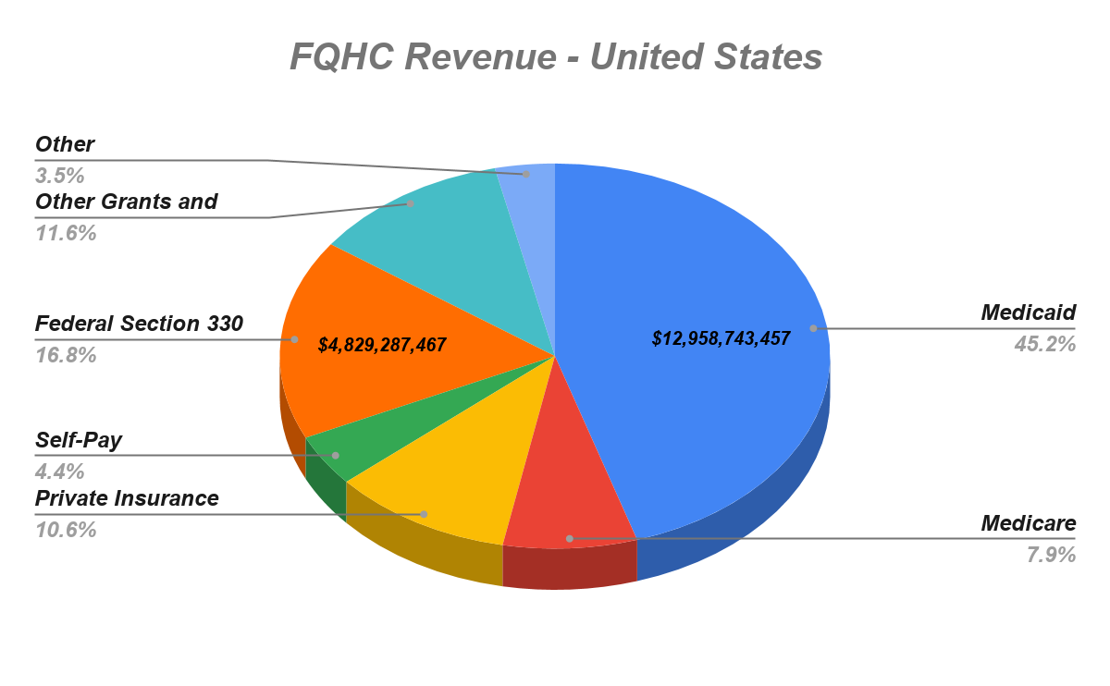
FQHCs are financed through various methods. These include a mix of Medicaid and Medicare reimbursements (with different payment methodologies), direct patient revenue, other third-party payers (private insurers), state funding, local funding, philanthropic organizations, and grant funding from the Bureau of Primary Health Care (BPHC) of HRSA of the U.S. Department of Health and Human Services (HHS).
The above chart shows the revenue distribution of FQHCs based on payer source (2018).
FQHC Revenue across all regions in the U.S (approx. 2018)
Source:
George Washington University analysis of the Health Resources and Services Administration’s Uniform Data System. Special Data Request, September 2019.
| Location | Medicaid | Medicare | Private Insurance | Self-Pay | Federal Section 330 Grants | Other Grants and Contracts | Other | Total |
| United States | $12,958,743,457 | $2,260,247,981 | $3,048,512,406 | $1,248,741,884 | $4,829,287,467 | $3,336,624,219 | $1,007,447,180 | $28,689,604,594 |
| Alabama | $52,785,795 | $17,803,287 | $17,114,860 | $12,744,350 | $83,625,546 | $13,471,556 | $4,344,085 | $201,889,479 |
| Alaska | $102,348,854 | $18,671,815 | $37,698,230 | $6,477,465 | $67,692,068 | $119,544,705 | $2,756,393 | $355,189,530 |
| Arizona | $337,972,854 | $47,634,000 | $71,949,881 | $23,395,361 | $83,428,217 | $41,485,739 | $5,472,766 | $611,338,818 |
| Arkansas | $62,148,511 | $24,046,228 | $30,622,521 | $12,429,111 | $54,555,352 | $9,120,521 | $1,735,385 | $194,657,629 |
| California | $3,704,343,504 | $411,514,109 | $291,192,054 | $148,976,225 | $658,760,061 | $615,047,232 | $334,581,140 | $6,164,414,325 |
| Colorado | $319,775,816 | $39,134,784 | $48,657,089 | $30,779,398 | $106,101,957 | $95,942,011 | $20,709,084 | $661,100,139 |
| Connecticut | $228,434,332 | $32,127,164 | $26,544,878 | $11,568,619 | $59,696,129 | $50,791,682 | $10,598,421 | $419,761,225 |
| Delaware | $11,773,644 | $1,479,685 | $2,463,464 | $4,386,233 | $13,557,989 | $5,219,063 | $470,309 | $39,350,387 |
| District of Columbia | $160,105,430 | $22,175,379 | $32,105,709 | $5,512,030 | $27,476,019 | $31,943,055 | $7,236,844 | $286,554,466 |
| Florida | $391,497,340 | $60,674,510 | $209,954,679 | $81,714,253 | $236,911,216 | $193,834,424 | $17,832,728 | $1,192,419,150 |
| Georgia | $66,177,853 | $48,142,417 | $57,295,748 | $30,758,262 | $117,787,006 | $28,848,026 | $9,877,675 | $358,886,987 |
| Hawaii | $107,408,992 | $15,806,563 | $17,253,126 | $5,783,071 | $31,398,131 | $32,520,603 | $3,907,118 | $214,077,604 |
| Idaho | $45,572,373 | $21,289,644 | $50,122,229 | $22,535,206 | $45,993,298 | $25,577,164 | $3,267,335 | $214,357,249 |
| Illinois | $455,197,448 | $56,238,990 | $131,100,822 | $64,116,380 | $201,027,383 | $137,469,419 | $29,398,121 | $1,074,548,563 |
| Indiana | $200,004,374 | $20,647,447 | $30,284,051 | $18,433,251 | $75,547,860 | $28,756,217 | $30,759,622 | $404,432,822 |
| Iowa | $83,853,103 | $13,542,737 | $23,553,367 | $12,655,645 | $38,528,294 | $19,319,034 | $1,624,245 | $193,076,425 |
| Kansas | $37,808,462 | $19,789,301 | $26,840,099 | $15,221,728 | $44,761,541 | $16,668,896 | $4,665,564 | $165,755,591 |
| Kentucky | $176,573,940 | $46,631,367 | $68,598,016 | $24,819,874 | $80,881,354 | $6,773,516 | $6,597,845 | $410,875,912 |
| Louisiana | $146,815,697 | $31,043,111 | $59,995,751 | $11,587,230 | $100,474,957 | $30,961,276 | $4,441,509 | $385,319,531 |
| Maine | $41,882,541 | $35,423,228 | $47,436,524 | $12,099,407 | $43,787,648 | $11,360,335 | $6,280,495 | $198,270,178 |
| Maryland | $150,688,381 | $29,260,626 | $73,964,146 | $13,146,680 | $57,449,364 | $35,657,860 | $21,090,583 | $381,257,640 |
| Massachusetts | $362,280,706 | $103,012,238 | $165,134,454 | $27,248,100 | $128,238,080 | $258,007,270 | $160,820,426 | $1,204,741,274 |
| Michigan | $314,285,715 | $68,214,766 | $79,638,020 | $28,291,497 | $127,807,919 | $44,375,118 | $9,855,849 | $672,468,884 |
| Minnesota | $75,452,268 | $12,577,519 | $16,837,190 | $11,935,453 | $42,977,632 | $29,987,097 | $4,128,981 | $193,896,140 |
| Mississippi | $32,037,428 | $18,436,338 | $22,813,575 | $21,440,111 | $74,626,865 | $14,886,816 | $1,657,237 | $185,898,370 |
| Missouri | $255,311,813 | $26,546,831 | $59,184,521 | $28,003,100 | $110,804,809 | $33,834,797 | $10,235,337 | $523,921,208 |
| Montana | $34,073,242 | $12,203,723 | $17,685,163 | $7,521,912 | $42,126,575 | $10,185,208 | $6,307,871 | $130,103,694 |
| Nebraska | $19,899,828 | $1,982,820 | $13,342,672 | $7,991,555 | $22,106,057 | $22,906,355 | $1,933,464 | $90,162,751 |
| Nevada | $33,773,688 | $11,166,606 | $12,531,690 | $3,172,460 | $21,069,529 | $15,948,721 | $706,509 | $98,369,203 |
| New Hampshire | $21,695,854 | $17,132,960 | $22,653,425 | $5,099,829 | $24,039,213 | $11,899,812 | $2,725,189 | $105,246,282 |
| New Jersey | $158,938,887 | $11,758,143 | $14,145,131 | $21,606,309 | $81,666,571 | $69,281,662 | $5,982,249 | $363,378,952 |
| New Mexico | $132,429,129 | $26,364,684 | $24,132,532 | $15,923,683 | $76,523,082 | $57,190,428 | $4,530,396 | $337,093,934 |
| New York | $1,461,356,192 | $201,623,297 | $250,926,163 | $50,171,017 | $269,626,284 | $385,124,022 | $91,523,863 | $2,710,350,838 |
| North Carolina | $90,190,949 | $59,012,065 | $65,516,943 | $50,837,624 | $133,899,942 | $40,248,341 | $26,574,283 | $466,280,147 |
| North Dakota | $11,640,795 | $3,863,326 | $9,419,592 | $4,474,860 | $10,746,019 | $908,251 | $1,001,661 | $42,054,504 |
| Ohio | $261,827,729 | $51,042,970 | $58,596,828 | $25,007,037 | $146,210,064 | $41,839,517 | $21,051,011 | $605,575,156 |
| Oklahoma | $58,934,312 | $20,089,581 | $28,480,968 | $19,992,107 | $58,679,531 | $10,582,038 | $2,883,612 | $199,642,149 |
| Oregon | $394,118,738 | $51,503,384 | $31,974,615 | $15,310,703 | $91,700,505 | $91,028,195 | $7,602,558 | $683,238,698 |
| Pennsylvania | $315,531,242 | $68,519,997 | $104,374,387 | $17,072,987 | $128,243,325 | $37,490,171 | $10,326,309 | $681,558,418 |
| Rhode Island | $109,670,334 | $15,761,096 | $19,797,174 | $5,830,348 | $28,040,434 | $14,890,907 | $4,960,361 | $198,950,654 |
| South Carolina | $95,328,346 | $89,583,350 | $103,316,045 | $25,145,381 | $89,314,251 | $31,444,029 | $18,322,528 | $452,453,930 |
| South Dakota | $11,514,028 | $4,903,220 | $10,207,221 | $6,525,886 | $17,900,812 | $3,435,235 | $1,231,547 | $55,717,949 |
| Tennessee | $80,779,671 | $26,920,974 | $41,375,639 | $15,091,806 | $87,348,642 | $31,856,403 | $3,747,729 | $287,120,864 |
| Texas | $405,350,935 | $68,050,313 | $170,985,325 | $92,159,958 | $258,162,160 | $309,998,557 | $26,687,781 | $1,331,395,029 |
| Utah | $29,700,875 | $11,520,256 | $16,681,038 | $13,794,751 | $39,878,950 | $24,880,704 | $3,574,692 | $140,031,266 |
| Vermont | $47,210,527 | $31,973,872 | $34,695,192 | $23,137,643 | $23,463,366 | $7,348,657 | $8,511,984 | $176,341,241 |
| Virginia | $54,549,880 | $39,744,588 | $42,438,653 | $26,005,991 | $85,805,735 | $20,677,091 | $4,357,021 | $273,578,959 |
| Washington | $769,937,162 | $89,428,910 | $129,151,433 | $58,320,292 | $139,027,744 | $94,896,347 | $14,596,022 | $1,295,357,910 |
| West Virginia | $116,781,516 | $57,847,408 | $83,808,357 | $28,402,025 | $68,591,429 | $16,910,711 | $12,143,151 | $384,484,597 |
| Wisconsin | $149,327,704 | $8,202,250 | $27,257,452 | $10,451,845 | $45,790,614 | $27,262,928 | $7,630,433 | $275,923,226 |
| Wyoming | $6,918,264 | $4,226,082 | $5,490,411 | $3,411,365 | $7,478,734 | $1,763,502 | $477,559 | $29,765,917 |
| American Samoa | $786,753 | $0 | $0 | $0 | $3,082,370 | $0 | $0 | $3,869,123 |
| Federated States of Micronesia | $0 | $0 | $24,112 | $84,319 | $3,186,592 | $0 | $0 | $3,295,023 |
| Guam | $2,451,828 | $53,941 | $17,002 | $132,489 | $2,173,874 | $2,330,520 | $137,227 | $7,296,881 |
| Marshall Islands | $0 | $0 | $0 | $31,865 | $1,061,772 | $1,086,917 | $0 | $2,180,554 |
| Northern Mariana Islands | $98,987 | $641 | $7,161 | $11,185 | $677,559 | $0 | $122,655 | $918,188 |
| Palau | $0 | $0 | $259,006 | $1,461,345 | $940,810 | $50,000 | $0 | $2,711,161 |
| Puerto Rico | $153,566,707 | $33,237,486 | $10,276,689 | $7,922,019 | $103,150,074 | $16,880,374 | $3,452,418 | $328,485,767 |
| U.S. Virgin Islands | $7,822,181 | $665,954 | $589,383 | $581,248 | $3,678,153 | $4,875,184 | $0 | $18,212,103 |
Definitions:
*Medicaid*: also includes the Children’s Health Insurance Program (CHIP), family planning programs, and state-funded coverage programs.
*Private Insurance*: includes employer-sponsored insurance and insurance purchased in the individual market (including the Marketplaces).
*Federal Section 330 Grants*: grants provided by the Health Services Resources Administration, Bureau of Primary Health Care under Section 330 of the Public Health Service Act.
*Other Grants and Contracts*: includes federal grants other than Section 330 grants, grants from state and local governments and private foundations, payments from state and local indigent care programs, and contracts.
*Other*: includes non-patient related revenue, such as fundraising, interest income, rent from tentants, etc.
Future of FQHCs
FQHCs have had significant growth in the past decades. The statistical data indicates that FQHCs have the potential to serve more patients by improving the quality of care. To provide quality care and improve patient experience, FQHCs must invest in the right technology like HealthViewX Care Orchestration Platform which provides the best solutions for the major challenges faced by the health centers.
Reference:
- https://www.cms.gov/Outreach-and-Education/Medicare-Learning-Network-MLN/MLNProducts/Downloads/fqhcfactsheet.pdf
- Kaiser Commission on Medicaid and the Uninsured (data from the National Association of Community Health Centers and the Uniform Data System (UDS) of the Health Resources and Services Administration (HRSA).
- Goldman, LE et al. Federally Qualified Health Centers and Private Practice Performance on Ambulatory Care Measures. American Journal of Preventive Medicine. 2012. 43(2):142-149. *Fontil et al. Management of Hypertension in Primary Care Safety-Net Clinics in the United States: A Comparison of Community Health Centers and Private Physicians’ Offices. Health Services Research. April 2017. 52:2.
- 2015 Uniform Data System. Bureau of Primary Health Care, HRSA, DHHS. National Center for Health Statistics. NCHS Data Brief. No. 220. November 2015. Hypertension Prevalence and Control Among Adults: United States, 2011 – 2014. National Committee for Quality Assurance. Comprehensive Diabetes Care, The State of Healthcare Quality (2016).
- Shi L, Tsai J, Higgins PC, Lebrun La. (2009). Racial/ethnic and socioeconomic disparities in access to care and quality of care for US health center patients compared with non-health center patients. J Ambul Care Manage 32(4): 342 – 50. Shi L, Leburn L, Tsai J and Zhu J. (2010). Characteristics of Ambulatory Care Patients and Services: A Comparison of Community Health Centers and Physicians’ Offices J Health Care for Poor and Underserved 21 (4): 1169-83. Hing E, Hooker RS, Ashman JJ. (2010). Primary Health Care in Community Health Centers and Comparison with Office-Based Practice. J Community Health. 2011 Jun; 36(3): 406 – 13.
- Shi L, Lebrun-Harris LA, Daly CA, et al. Reducing Disparities in Access to Primary Care and Patient Satisfaction with Care: The Role of Health Centers. Journal of Health Care for the Poor and Underserved. 2013; 24(1):56-66.
- George Washington University analysis of the Health Resources and Services Administration’s Uniform Data System. Special Data Request, March 2018.
- Community Health Center Revenues by Payer Source.

