Tag Archives: hipaa compliance

FQHC Statistics – Growth, Region, Performance and Revenue – Federally Qualified Health Centers across the USA

What are Federally Qualified Health Centers (FQHCs)?

Federally Qualified Health Centers (FQHCs) in the United States are non-profit entities that are composed of clinical care providers, who operate at comprehensive federal standards. FQHCs were originally intended to provide the medically underserved population with quality care to minimize patient load in hospital emergency rooms.

According to Medicare and Medicaid statutes, FQHCs receive federal funding under Section 330 of the Public Health Service (PHS) Act to provide comprehensive primary care services to uninsured and underinsured populations thus ensuring that comprehensive care is available to all, regardless of income or insurance status. Medicare pays FQHCs based on the FQHC Prospective Payment System (PPS) for medically necessary primary health services and qualified preventive health services given by an FQHC practitioner.

To receive federal funding, FQHCs must meet the following requirements:

  • Be located in a federally designated medically underserved area (MUA) or serve medically underserved populations (MUP)
  • Provide comprehensive primary care
  • Adjust charges for health services on a sliding fee schedule according to patient income
  • Be governed by a community board of which a majority of members are patients at the FQHC

The Growth of FQHCs

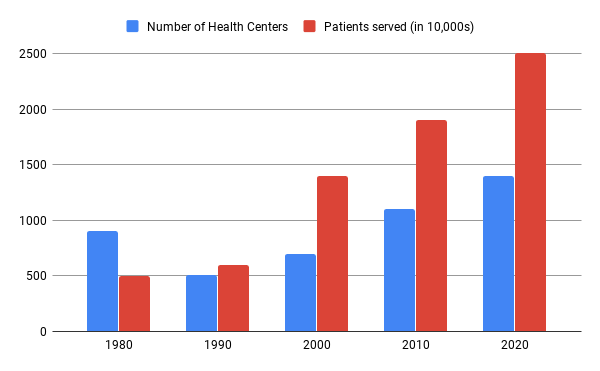
In the early 1960s, there were only 8 health centers in the U.S. Ever since then, the numbers have increased exponentially. By 2001, there were 748 health centers at 4,128 service sites around the nation, serving approximately 10 million individuals.

Federal funding for health centers has increased from $750 million in 1996 to $2.2 billion in 2010. Federal support has increased tremendously over the last 10 years. In 2011, there were 1,128 health centers providing care to more than 8,000 rural and urban delivery sites in the U.S. and territories. Today, there are 1,400 organizations with 11,200 facilities serving about 25 million individuals every year.

The above chart shows the growth of health centers from its inception in 1980 till 2020. The chart also shows the exponential increase in the number of patients served over the years.

FQHCs in various regions across the U.S

State State Code Number of FQHCs
California CA 178
Texas TX 73
New York NY 70
Florida FL 48
Ohio OH 47
Illinois IL 45
Pennsylvania PA 44
North Carolina NC 40
Michigan MI 39
Massachusetts MA 39
Georgia GA 35
Louisiana LA 36
Oregon OR 33
West Virginia WV 31
Tennessee TN 30
Alaska AK 28
Missouri MO 28
Washington WA 27
Virginia VA 26
Indiana IN 25
Kentucky KY 23
New Jersey NJ 23
South Carolina SC 23
Arizona AZ 21
Mississippi MS 21
Colorado CO 21
Oklahoma OK 20
Maine ME 20
Kansas KA 18
Maryland MD 17
Montana MT 17
New Mexico NM 17
Wisconsin WI 18
Connecticut CT 17
Minnesota MN 16
Alabama AL 15
Hawaii HI 14
Iowa IA 14
Idaho ID 14
Puerto Rico PR 14
Utah UT 13
Arkansas AR 12
New Hampshire NH 11
Vermont VT 11
District of Columbia WDC 8
Rhode Island RI 8
Nebraska NE 7
Nevada NV 7
Wyoming WY 6
South Dakota SD 5
North Dakota ND 4
Delaware DE 3
Virgin Islands VI 3
Guam GU 2
Northern Mariana Islands MP 2

Performance of FQHCs

Figure 2 - Health Centers Perform Better on Ambulatory Care Quality Measures than Private Practice Physicians

Figure 2 – Health Centers Perform Better on Ambulatory Care Quality Measures than Private Practice Physicians

The above chart shows how health centers have outperformed private practice physicians in every aspect of service.

Figure 3 - Health Centers Provide More Preventive Services than Other Primary Care Providers

Figure 3 – Health Centers Provide More Preventive Services than Other Primary Care Providers

The above chart shows a comparison between health centers and other providers based on the number of patient visits for various ailments.

Figure 4 - Health Center Patients Are More Satisfied with the Overall Care Received Compared with Low Income Patients Nationally

Figure 4 – Health Center Patients Are More Satisfied with the Overall Care Received Compared with Low Income Patients Nationally

The above chart shows the level of satisfaction of low-income patients. Health center patients have a huge level of satisfaction as compared to other low-income patients nationally.

Financing and Reimbursements for FQHCs

FQHCs are required by law to provide services to all people, regardless of ability to pay. The uninsured are charged for services on a board-approved sliding-fee scale, which is based on a patient’s family income and size.

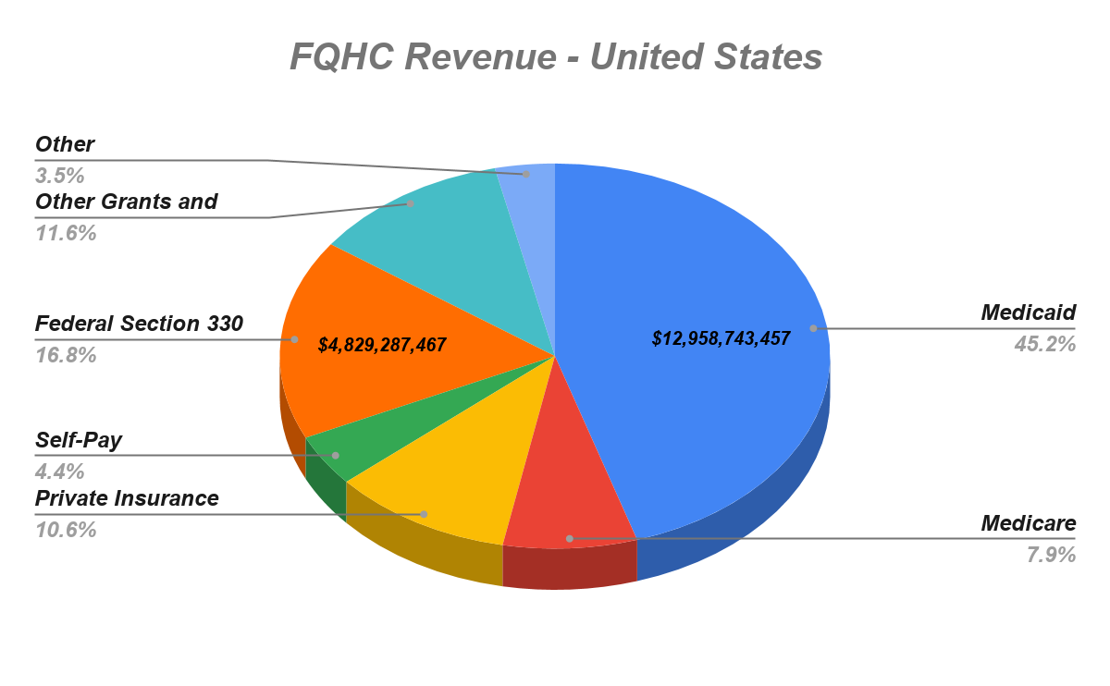
FQHCs are financed through various methods. These include a mix of Medicaid and Medicare reimbursements (with different payment methodologies), direct patient revenue, other third-party payers (private insurers), state funding, local funding, philanthropic organizations, and grant funding from the Bureau of Primary Health Care (BPHC) of HRSA of the U.S. Department of Health and Human Services (HHS).

The above chart shows the revenue distribution of FQHCs based on payer source (2018).

FQHC Revenue across all regions in the U.S (approx. 2018)

Source:
George Washington University analysis of the Health Resources and Services Administration’s Uniform Data System. Special Data Request, September 2019.

Location Medicaid Medicare Private Insurance Self-Pay Federal Section 330 Grants Other Grants and Contracts Other Total
United States $12,958,743,457 $2,260,247,981 $3,048,512,406 $1,248,741,884 $4,829,287,467 $3,336,624,219 $1,007,447,180 $28,689,604,594
Alabama $52,785,795 $17,803,287 $17,114,860 $12,744,350 $83,625,546 $13,471,556 $4,344,085 $201,889,479
Alaska $102,348,854 $18,671,815 $37,698,230 $6,477,465 $67,692,068 $119,544,705 $2,756,393 $355,189,530
Arizona $337,972,854 $47,634,000 $71,949,881 $23,395,361 $83,428,217 $41,485,739 $5,472,766 $611,338,818
Arkansas $62,148,511 $24,046,228 $30,622,521 $12,429,111 $54,555,352 $9,120,521 $1,735,385 $194,657,629
California $3,704,343,504 $411,514,109 $291,192,054 $148,976,225 $658,760,061 $615,047,232 $334,581,140 $6,164,414,325
Colorado $319,775,816 $39,134,784 $48,657,089 $30,779,398 $106,101,957 $95,942,011 $20,709,084 $661,100,139
Connecticut $228,434,332 $32,127,164 $26,544,878 $11,568,619 $59,696,129 $50,791,682 $10,598,421 $419,761,225
Delaware $11,773,644 $1,479,685 $2,463,464 $4,386,233 $13,557,989 $5,219,063 $470,309 $39,350,387
District of Columbia $160,105,430 $22,175,379 $32,105,709 $5,512,030 $27,476,019 $31,943,055 $7,236,844 $286,554,466
Florida $391,497,340 $60,674,510 $209,954,679 $81,714,253 $236,911,216 $193,834,424 $17,832,728 $1,192,419,150
Georgia $66,177,853 $48,142,417 $57,295,748 $30,758,262 $117,787,006 $28,848,026 $9,877,675 $358,886,987
Hawaii $107,408,992 $15,806,563 $17,253,126 $5,783,071 $31,398,131 $32,520,603 $3,907,118 $214,077,604
Idaho $45,572,373 $21,289,644 $50,122,229 $22,535,206 $45,993,298 $25,577,164 $3,267,335 $214,357,249
Illinois $455,197,448 $56,238,990 $131,100,822 $64,116,380 $201,027,383 $137,469,419 $29,398,121 $1,074,548,563
Indiana $200,004,374 $20,647,447 $30,284,051 $18,433,251 $75,547,860 $28,756,217 $30,759,622 $404,432,822
Iowa $83,853,103 $13,542,737 $23,553,367 $12,655,645 $38,528,294 $19,319,034 $1,624,245 $193,076,425
Kansas $37,808,462 $19,789,301 $26,840,099 $15,221,728 $44,761,541 $16,668,896 $4,665,564 $165,755,591
Kentucky $176,573,940 $46,631,367 $68,598,016 $24,819,874 $80,881,354 $6,773,516 $6,597,845 $410,875,912
Louisiana $146,815,697 $31,043,111 $59,995,751 $11,587,230 $100,474,957 $30,961,276 $4,441,509 $385,319,531
Maine $41,882,541 $35,423,228 $47,436,524 $12,099,407 $43,787,648 $11,360,335 $6,280,495 $198,270,178
Maryland $150,688,381 $29,260,626 $73,964,146 $13,146,680 $57,449,364 $35,657,860 $21,090,583 $381,257,640
Massachusetts $362,280,706 $103,012,238 $165,134,454 $27,248,100 $128,238,080 $258,007,270 $160,820,426 $1,204,741,274
Michigan $314,285,715 $68,214,766 $79,638,020 $28,291,497 $127,807,919 $44,375,118 $9,855,849 $672,468,884
Minnesota $75,452,268 $12,577,519 $16,837,190 $11,935,453 $42,977,632 $29,987,097 $4,128,981 $193,896,140
Mississippi $32,037,428 $18,436,338 $22,813,575 $21,440,111 $74,626,865 $14,886,816 $1,657,237 $185,898,370
Missouri $255,311,813 $26,546,831 $59,184,521 $28,003,100 $110,804,809 $33,834,797 $10,235,337 $523,921,208
Montana $34,073,242 $12,203,723 $17,685,163 $7,521,912 $42,126,575 $10,185,208 $6,307,871 $130,103,694
Nebraska $19,899,828 $1,982,820 $13,342,672 $7,991,555 $22,106,057 $22,906,355 $1,933,464 $90,162,751
Nevada $33,773,688 $11,166,606 $12,531,690 $3,172,460 $21,069,529 $15,948,721 $706,509 $98,369,203
New Hampshire $21,695,854 $17,132,960 $22,653,425 $5,099,829 $24,039,213 $11,899,812 $2,725,189 $105,246,282
New Jersey $158,938,887 $11,758,143 $14,145,131 $21,606,309 $81,666,571 $69,281,662 $5,982,249 $363,378,952
New Mexico $132,429,129 $26,364,684 $24,132,532 $15,923,683 $76,523,082 $57,190,428 $4,530,396 $337,093,934
New York $1,461,356,192 $201,623,297 $250,926,163 $50,171,017 $269,626,284 $385,124,022 $91,523,863 $2,710,350,838
North Carolina $90,190,949 $59,012,065 $65,516,943 $50,837,624 $133,899,942 $40,248,341 $26,574,283 $466,280,147
North Dakota $11,640,795 $3,863,326 $9,419,592 $4,474,860 $10,746,019 $908,251 $1,001,661 $42,054,504
Ohio $261,827,729 $51,042,970 $58,596,828 $25,007,037 $146,210,064 $41,839,517 $21,051,011 $605,575,156
Oklahoma $58,934,312 $20,089,581 $28,480,968 $19,992,107 $58,679,531 $10,582,038 $2,883,612 $199,642,149
Oregon $394,118,738 $51,503,384 $31,974,615 $15,310,703 $91,700,505 $91,028,195 $7,602,558 $683,238,698
Pennsylvania $315,531,242 $68,519,997 $104,374,387 $17,072,987 $128,243,325 $37,490,171 $10,326,309 $681,558,418
Rhode Island $109,670,334 $15,761,096 $19,797,174 $5,830,348 $28,040,434 $14,890,907 $4,960,361 $198,950,654
South Carolina $95,328,346 $89,583,350 $103,316,045 $25,145,381 $89,314,251 $31,444,029 $18,322,528 $452,453,930
South Dakota $11,514,028 $4,903,220 $10,207,221 $6,525,886 $17,900,812 $3,435,235 $1,231,547 $55,717,949
Tennessee $80,779,671 $26,920,974 $41,375,639 $15,091,806 $87,348,642 $31,856,403 $3,747,729 $287,120,864
Texas $405,350,935 $68,050,313 $170,985,325 $92,159,958 $258,162,160 $309,998,557 $26,687,781 $1,331,395,029
Utah $29,700,875 $11,520,256 $16,681,038 $13,794,751 $39,878,950 $24,880,704 $3,574,692 $140,031,266
Vermont $47,210,527 $31,973,872 $34,695,192 $23,137,643 $23,463,366 $7,348,657 $8,511,984 $176,341,241
Virginia $54,549,880 $39,744,588 $42,438,653 $26,005,991 $85,805,735 $20,677,091 $4,357,021 $273,578,959
Washington $769,937,162 $89,428,910 $129,151,433 $58,320,292 $139,027,744 $94,896,347 $14,596,022 $1,295,357,910
West Virginia $116,781,516 $57,847,408 $83,808,357 $28,402,025 $68,591,429 $16,910,711 $12,143,151 $384,484,597
Wisconsin $149,327,704 $8,202,250 $27,257,452 $10,451,845 $45,790,614 $27,262,928 $7,630,433 $275,923,226
Wyoming $6,918,264 $4,226,082 $5,490,411 $3,411,365 $7,478,734 $1,763,502 $477,559 $29,765,917
American Samoa $786,753 $0 $0 $0 $3,082,370 $0 $0 $3,869,123
Federated States of Micronesia $0 $0 $24,112 $84,319 $3,186,592 $0 $0 $3,295,023
Guam $2,451,828 $53,941 $17,002 $132,489 $2,173,874 $2,330,520 $137,227 $7,296,881
Marshall Islands $0 $0 $0 $31,865 $1,061,772 $1,086,917 $0 $2,180,554
Northern Mariana Islands $98,987 $641 $7,161 $11,185 $677,559 $0 $122,655 $918,188
Palau $0 $0 $259,006 $1,461,345 $940,810 $50,000 $0 $2,711,161
Puerto Rico $153,566,707 $33,237,486 $10,276,689 $7,922,019 $103,150,074 $16,880,374 $3,452,418 $328,485,767
U.S. Virgin Islands $7,822,181 $665,954 $589,383 $581,248 $3,678,153 $4,875,184 $0 $18,212,103

Definitions:
*Medicaid*: also includes the Children’s Health Insurance Program (CHIP), family planning programs, and state-funded coverage programs.

*Private Insurance*: includes employer-sponsored insurance and insurance purchased in the individual market (including the Marketplaces).

*Federal Section 330 Grants*: grants provided by the Health Services Resources Administration, Bureau of Primary Health Care under Section 330 of the Public Health Service Act.

*Other Grants and Contracts*: includes federal grants other than Section 330 grants, grants from state and local governments and private foundations, payments from state and local indigent care programs, and contracts.

*Other*: includes non-patient related revenue, such as fundraising, interest income, rent from tentants, etc.

Future of FQHCs

FQHCs have had significant growth in the past decades. The statistical data indicates that FQHCs have the potential to serve more patients by improving the quality of care. To provide quality care and improve patient experience, FQHCs must invest in the right technology like HealthViewX Care Orchestration Platform which provides the best solutions for the major challenges faced by the health centers.

Reference:

  1. https://www.cms.gov/Outreach-and-Education/Medicare-Learning-Network-MLN/MLNProducts/Downloads/fqhcfactsheet.pdf
  2. Kaiser Commission on Medicaid and the Uninsured (data from the National Association of Community Health Centers and the Uniform Data System (UDS) of the Health Resources and Services Administration (HRSA).
  3. Goldman, LE et al. Federally Qualified Health Centers and Private Practice Performance on Ambulatory Care Measures. American Journal of Preventive Medicine. 2012. 43(2):142-149. *Fontil et al. Management of Hypertension in Primary Care Safety-Net Clinics in the United States: A Comparison of Community Health Centers and Private Physicians’ Offices. Health Services Research. April 2017. 52:2.
  4. 2015 Uniform Data System. Bureau of Primary Health Care, HRSA, DHHS. National Center for Health Statistics. NCHS Data Brief. No. 220. November 2015. Hypertension Prevalence and Control Among Adults: United States, 2011 – 2014. National Committee for Quality Assurance. Comprehensive Diabetes Care, The State of Healthcare Quality (2016).
  5. Shi L, Tsai J, Higgins PC, Lebrun La. (2009). Racial/ethnic and socioeconomic disparities in access to care and quality of care for US health center patients compared with non-health center patients. J Ambul Care Manage 32(4): 342 – 50. Shi L, Leburn L, Tsai J and Zhu J. (2010). Characteristics of Ambulatory Care Patients and Services: A Comparison of Community Health Centers and Physicians’ Offices J Health Care for Poor and Underserved 21 (4): 1169-83. Hing E, Hooker RS, Ashman JJ. (2010). Primary Health Care in Community Health Centers and Comparison with Office-Based Practice. J Community Health. 2011 Jun; 36(3): 406 – 13.
  6. Shi L, Lebrun-Harris LA, Daly CA, et al. Reducing Disparities in Access to Primary Care and Patient Satisfaction with Care: The Role of Health Centers. Journal of Health Care for the Poor and Underserved. 2013; 24(1):56-66.
  7. George Washington University analysis of the Health Resources and Services Administration’s Uniform Data System. Special Data Request, March 2018.
  8. Community Health Center Revenues by Payer Source.

5 Benefits To Look For Before Choosing A Referral Management Software

Referral process in healthcare

A referral process in healthcare, a primary care physician creates a referral order in the EMR for a patient to see a specialist or imaging center for a specific medical service. PCPs hold the responsibility for managing and tracking their patient referrals throughout its life cycle. But the PCPs face challenges in managing the referral process. Challenges such as increasing patient referrals, new specialist and imaging centers opening up, manual referral follow-ups, etc prevent PCPs from managing the referral process effectively. This is when a healthcare referral management system comes to play.

Importance of referral management software in healthcare

There are many reasons for why having a referral management software is necessary. Healthcare processes are always criticized for being costly and inefficient. Referral management software is a potential solution to the healthcare problems. In this day and age, healthcare is moving towards improving quality and efficiency, while also decreasing the cost. It’s all about improving the experience for their patients. The entire industry is adapting technology for streamlining administrative operations.
Here are some alarming statistics that reiterate the need for a referral management solution,

  • Any health system will have an average referral leakage of 55-65%
  • Approximately 33% of patients do not follow-up with the specialist to whom they are referred
  • 25 to 50% of referring physicians do not know whether their patients see the specialist
  • Over 50% of the current referral process is redundant and repetitive

In order to reduce referral leakage, increase patient follow-ups and improve the current referral process, a referral management software is needed.

Benefits a referral management software should deliver

The following are the benefits that a referral management software should deliver in order to make the referral process efficient,

1. Reduced referral leakage

Referral leakage is a huge problem hemorrhaging health systems in the country. Missed referrals are the main reasons for millions of lost revenue.
After implementing an effective referral management solution, the health system will see an immediate reduction in referral leakage. It will have a positive impact on the health system by making it more efficient and better equipped to serve patients. The immediate effect a health system will recognize is fewer patients leaving the health system thus saving millions in lost revenue.
Click here to learn more about how a health system can reduce referral leakage in their network.

“HealthViewX reduces referral leakage by helping referral coordinators in identifying the right receiving providers within the care continuum”

2. Decreased lead times

Operational inefficiency hampers a referral network to a greater extent. Dead time or unnecessarily long lead times are an inconvenience to both patients and providers alike.
For eg – PCPs frequently refer patients to specialists without considering the benefit for the specialty. About 65% of referral created by PCPs are unnecessary. These unnecessary visits will lead to long waiting times for those who do need to see a specialist. This will in turn result in poor health outcomes.
These problems can be solved by investing in a referral management solution. It will make the process efficient, decrease lead times, shorten patient waiting times and improve patient satisfaction. Increased operational efficiency will lead to shorter patient waiting times and thus more patients being seen.

“HealthViewX improves operational efficiency by automating the primary care to specialist referral process in healthcare”

3. Improved referral closure rates

With a referral management system in place, it is easy to track referrals depending on the status. Improved referral tracking leads to increased referral loop closures.

“With HealthViewX Patient Referral Management Software, health systems can track referrals in real-time. It provides a timeline view that helps referring and receiving physicians to know in which status the referral is.”

4. Improved referral utilization

Tracking patients’ progress through the care continuum helps to improve utilization for both providers and staff. Referral Management Software will enable health systems to see more patients.
PCPs can easily send patients to specialists by searching through directories and evaluating providers based on reviews, quality, and even familiarity.
It’s even better when this whole process can be condensed into one application, allowing both doctors and staff alike to access provider directories.

“HealthViewX Patient Referral Management supports features such as Intelligent Provider Match and Online Scheduling. It enables better utilization of the existing staff in health systems.”

5. Additional patient time

Finally, and maybe most importantly, referral management software must save time on administrative processes. This will increase the time for the actual medical visit.


Reference
https://www.mass.gov/files/documents/2016/08/uy/2011-hcctd-full.pdf
https://www.beckershospitalreview.com/payer-issues/3-important-statistics-about-provider-referrals.html
http://www.ncbi.nlm.nih.gov/pmc/articles/PMC3160594

How Can Price Transparency Impact The Healthcare Industry?

Patient financial responsibility is the greatest challenge of healthcare industry. For a long time, healthcare experts have argued that price transparency will help patients in making informed healthcare decisions thereby decreasing healthcare costs.

In August 2018, CMS stated in its updates to the Inpatient Prospective Payment System (IPPS) and Long-Term Care Hospital (LTCH PPS) final rules that price transparency will become a nationwide industry standard.

With effect from January 1, 2019, hospitals across the country are responsible for full price transparency. As per the IPPS and LTCH PPS rules, hospitals must list their prices online in a “machine-readable format.”

CMS approach to enforcing price transparency

Previously, hospitals were required to make their prices publicly available, but not necessarily in a digital format. In the new rule, CMS has mandated that these new price transparency resources be in a machine-readable format. CMS analyzed public comments on the most efficient way to achieve this. Finally, CMS called on all hospitals to list their chargemaster prices on a publicly-available Excel spreadsheet. The searchable spreadsheet will make it easier for patients to use.

Hiccups in the existing approach by CMS

Many questions have been raised about this approach.

  • Critics claim that charge master prices are not ideal for patients. Between insurance, subsidies, and other payment design, patients usually pay less than chargemaster price.
  • The feasibility of an Excel spreadsheet having all prices is a big question.
  • As more organizations publish their price transparency lists, more difficulties may come to light.

How can price transparency help patients?

  • Digital price transparency will enable patients to more easily access this information.
  • Price transparency will enable patients to make more informed decisions about care access that minimize their out-of-pocket costs and total expenditures borne by Medicare and Medicaid.
  • Increased price transparency will improve the patient experience of care.
  • Although price transparency itself cannot lower healthcare costs, but it may create market pressure that in turn lowers patient costs.
  • Additionally, price transparency will allow patients to choose the best care option for their needs.

The healthcare industry is still debating about the efficacy of price transparency. Healthcare price transparency tools have already made their mark in the healthcare industry. Do such tools improve patient experiences with healthcare or cut costs? How can organizations reconfigure these tools to increase its effectiveness?

Can price transparency reduce healthcare costs?

According to a 2016 study published in Health Affairs, it was found that price transparency tool actually increased out-of-pocket outpatient spending by about $59 per patient. The researchers suggested that it must must have been due to low patient awareness or perceived need of the tool.

Moreover, cost compare tools did not show many meaningful areas for cost savings.

Other studies have also shown similar results. A 2017 report by the American Journal of Managed Care found that though patients liked the idea of a cost comparison tool, they saw little use of the tool. They either forgot to use the tool before seeking care or did not see any use because they were already beyond their deductible or saw consistent copayments at their doctor’s office.It also touched on the idea of patient loyalty. Although patients could use price transparency tools to find a less expensive care option of equal quality, a sense of loyalty kept them going to their current clinicians.

Payers who offer price transparency tools have also had little luck with the tools. A 2017 report published by Health Affairs found that although scanning a cost compare website could result in 14% cost cuts for imaging services, only 1% of patients actually use the tool, making it of little use.

What do industry professionals say?

Although price transparency tools are not currently impacting the rising healthcare costs, these tools still have the potential to reduce spending and improve patient experience.

If properly utilized, cost compare technology should help patients cut their own healthcare spending because they know the lower-cost providers to visit. Patients with access to a price transparency tool have the opportunity to compare cost and quality and make their preferred treatment selection based on that data. Ideally, this will lead patients to a lower-cost option.

Clinics have little incentive to lower their costs when patients do not know how much they’ll pay before they receive the service. But if all clinics knew patients were visiting a high-quality facility with substantially lower costs, area competitors could be forced to change their prices, as well.

How can organizations make price transparency work?

Making price transparency tools that are attractive and usable for patients will be critical for delivering on the promise of cost compare. Simply offering a price transparency tool will not lower costs. Patients must actually use these systems to select lower-cost care.

As the healthcare industry continues to place more financial burden on patients, it will need to adopt strategies that help patients. High copay and high-deductible health plans have put patients in the role of the healthcare consumer. Price transparency tools are a key retail-style engagement strategy that will help consumers make better decisions about where to access care.

But in order to make those price transparency tools effective, industry leaders must keep the patient at the center of their design. Making a usable cost compare tool that uses simple language and factors in metrics that are important to patients will be integral going forward.

Reference

https://patientengagementhit.com/news/myhealthedata-patients-over-paperwork-key-in-cms-final-rules

https://jamanetwork.com/journals/jama/fullarticle/2518264

https://patientengagementhit.com/news/price-transparency-tools-receive-tepid-patient-reactions

https://patientengagementhit.com/news/4-patient-engagement-strategies-to-improve-patient-retention

https://www.healthaffairs.org/doi/full/10.1377/hlthaff.2016.1636

How HealthViewX Patient Referral Management Software Helps People In Different Designations In Healthcare?

Why is Patient Referral Management important for hospitals?

Patient begin a journey with the hospital when they are referred to that hospital to improve their health condition. Their expectation of the referral is usually high as they have sought another hospital for better experience and treatment. So hospitals must try to live up to the expectations of their patients. In order to manage huge volume of referrals, a hospital must have an effective Patient Referral Management System in place. This blog highlights challenges faced by operations manager, revenue cycle manager, healthcare IT department, patient referral coordinators and care providers (physicians and specialists) and how HealthViewX Patient Referral Management Software can help.

Challenges faced by physicians and specialists

Physicians and specialists play pivotal roles in the patient referral process. Physicians or PCPs hold the responsibility of initiating referrals. A patient visits the PCP and it is the discretion of the PCP to refer the patient to a specialist. What problems do physicians face in a referral process?

  1. Manual and time-consuming process – The process of creating a referral is too manual and time-consuming. In every stage of the referral, the physician has to put in a lot of effort. Here are few instances,
  • The physician has to wait for the insurance pre-authorization process to be done
  • Finding the right specialist takes a lot of effort from the physician’s side
  • After sending the referral, the physician has to wait for referral updates from the specialist.

From a specialist’s perspective the referral process is cumbersome. A specialist faces the following challenges,

  1. Multiple referral channels – For the specialist/imaging center who receive referrals face more difficulties than the referring provider. The receive referrals through various channels like fax, email, direct message, website, user-filled forms, etc. Managing and tracking all of it manually is a tedious task. The chances of missing out on a referral are high.
  2. Poor communication framework – The existing referral process has no quick mode of communication to contact the PCP or referral coordinator for missing information. The specialist has to wait till he/she gets the necessary information before starting with the referral process.

Challenges faced by referral coordinators

After a referral request is initiated, then it is the job of the referral coordinator to create a referral. A referral faces the following challenges,

  1. Insurance pre-authorization – A referral coordinator has to consult the insurance company if the diagnosis prescribed meet the insurance requirements of the patient. This process takes time as the referral coordinator has to wait for the insurance company to respond.
  2. Finding the right specialist/imaging center – The next big step after insurance pre-authorization is finding the right specialist or imaging center for the patient. The referral coordinator has to consider many factors like the patient’s convenience, specialist’s availability, new specialists in the locality, etc. This is time-consuming as there will be many specialists and imaging centers. Narrowing down the search manually will be difficult for the referral coordinator.
  3. Handling multiple software – A referral coordinator has to handle an EHR, fax system, appointment scheduling software all at the same time. The coordinator has to
    • Collect the patient information and demographics from the EHR
    • Do the insurance pre-authorization
    • Find the specialist
    • Send out the referral as a hard-copy fax

Handling so many things at the same time is tedious for the referral coordinators

Challenges faced by an operations manager

  1. Patient Referral Leakage – An operations manager will be primarily worried about how many patients are referred out of the network. Patient referral leakage is a determining factor in a referral network. In many cases, the patients are referred out-of-network even when there are appropriate specialists within the network.
  2. Referral Analytics –  As a large number of referrals flow in and out of the network, it is difficult to track the exact number. It is also tedious to track the number of referrals in various status and to close referral loops. The operations manager also needs to know how many referrals were sent or received, how many were processed, how many are yet to be processed, etc.

Challenges faced by a revenue cycle manager

  1. Patient no-show rates – After receiving the referral, the specialist/imaging center schedules appointments with the patient. In some cases, the patients are not notified clearly about the appointment. When patients do not show up, it is difficult for the specialist/imaging center to track. It results in revenue loss and patient dissatisfaction.
  2. Costly software – As mentioned earlier, a referral process needs an EMR/EHR, appointment scheduling software and a fax integration system. So many softwares for a single process is not efficient.

Challenges faced by an IT strategist

  1. Handling sensitive patient data – Patient data must be handled securely. Considering the current manual process, it is difficult to maintain data security.

How can HealthViewX solution add value to the process?

    1. Insurance pre-authorization process HealthViewX automates the insurance pre-authorization process. The provider need not coordinate with the insurance company for prior authorization. The HealthViewX solution will do it for them. This reduces the manual effort of the referral coordinators.
    2. Intelligent Provider Match – The HealthViewX “Smart Search” feature makes it easy for the referring provider in finding the right provider. It has smart filters and search options that help in narrowing down the specialist based on the requirements. This saves a lot of time for the referral coordinators.
    3. Timeline View to track referralsWith the help of a referral status, the referring provider can get to know what stage the referral is. A timeline view shows a history of stages through which the referral has progressed. The chances of a referring provider missing out on referral updates are very less.
    4. Referral closure and feedback – The referring provider can close the referral when it gets completed. The receiving provider and the patient can give a feedback on the referral process to the referring provider. Thus the referring provider can make it easy for the other the next time.
    5. Multi-channel referral consolidation – The HealthViewX solution can capture fax, phone, email, online form referrals or any other referrals in a single interface. It makes it easy to monitor and manage all channels of referrals in a single queue.
    6. Patient coordination framework – After finding the receiving provider, the referral coordinator refers the patient. When the receiving provider receives the referral, the provider will get notified of the referral. Even the patient will be notified of the referral. The receiving provider can schedule appointments based on the patient’s comfort. This will cut down patient no-show rates.
    7. Referral Analytics – Helps in tracking the number of referrals and gives complete information about the referrals processed, missed, scheduled etc with the help of a Referral Data-centric Dashboard. It helps the operations manager in taking informed decisions.
    8. HIPAA compliance – The solution is completely HIPAA compliant which enables secure patient data exchange.

HealthViewX Patient Referral Management solution smooths the referral process and solves challenges faced by people in different designations in healthcare. Do you want to know more about HealthViewX HIPAA compliant Patient Referral Management solution? Schedule a demo with us.

Why do Federally Qualified Health Centers need a Referral Management Software In Addition To An EMR?

Patient Referral Management is crucial for Federally Qualified Health Centers (FQHCs). With the advent of the Patient Protection and Affordable Healthcare Act, Electronic Health Records have been widely adopted across many FQHCs. There are many benefits to EHRs like improved,

  • Accessibility to patient data
  • Charge capture
  • Preventative health

Let us look into each of them in detail to understand an EMR/EHR implementation better.

Pros of EHR/EMR

1. Improved data accessibility

Before EHRs, access to medical charts required a fair amount of physical labor. For example, every time a patient visits the physician’s clinic or hospital, physician physically pulls their file from a storage space. As a result of this back and forth exchange, there was a greater chance of human error and charts would sometimes be missing information or be chronologically out-of-order.

EHRs, on the other hand, have eliminated the physical transporting, sifting and filing charts, making data available at all times. Additionally, for systems that allow remote access to charts, clinicians can even be offsite and still securely access patient files.

2. Computerized physician order entry

CPOE allows physicians to place lab and imaging orders, prescriptions and other notes electronically. This reduces the error of handwritten orders and allows the patient’s other physicians within the same network access to the order.

3.Preventative health

EHRs allow prompts for preventative health screenings. During routine doctor or urgent care visits, the physician has access to preventive health records conveniently in one place. If the patient is due for a cancer screening (such as mammogram or colonoscopy), or blood pressure testing, the referral coordinator can easily look this up via the EHR system and schedule an appointment for the patient.

4. Ease sign off for PAs and NPs

While this varies from state-to-state by law, physician assistants and nurse practitioners are typically required to have their notes approved and signed off on by their supervising physician. EHRs allow the revision and cosigning of notes to happen electronically as opposed to physically moving and signing the paper.

5. e-messaging between providers

As any referral coordinator can attest referral information, telephone tag between providers can be common and is a big time-waster. With EHR software, physicians can e-message across practices. One situation that benefits in particular from e-messaging is referrals. Rather than playing telephone tag to get an appointment scheduled, the physician electronically sends a message to schedule the appointment.

How can a Patient Referral Management Referral Management work in cohesion with an EMR/EHR system?

FQHCs prefer working with EMR/EHR systems because they are comfortable with it. So they do not wish to move out their EHR/EMR system. 

How great it would be if a Patient Referral Management software could integrate seamlessly with an EMR/EHR system? It can help in ensuring end-to-end Patient Referral Management without disturbing the existing system.

An EHR/EMR system has many advantages but when it is complemented with a Referral Management software practices can experience many more benefits.

HealthViewX Patient Referral Management solution provides easy steps to integrate with a practice’s EMR/EHR system. The patient demographics, diagnostic reports, test results or any sensitive information can be transferred safely. The solution is HIPAA-compliant with complete data security. It has the following features,

  1. Outbound Referrals – HealthViewX Referral Management Solution can integrate with both the receiving and referring end. For inbound referrals, it helps in channelizing various sources into one single queue. In case of outbound referrals, it facilitates integration with the existing system to read the patient data and send out referrals.
  2. Referral Timeline – In HealthViewX Referral Management System, any referral has a timeline, to capture and notify the progress of the referral to all the stakeholders. A referral will be mapped to a status which helps in tracking it better. For e.g. – If a patient does not show up for the appointment, the status of the referral can be changed to no-show and an appropriate reason can also be given. With the help of a referral timeline, the providers can always be aware of what is going on with the referral.
  3. Workflow and Task Management – A workflow can be defined on how the referral flow must be(business rules). Providers can create tasks to manage referrals by assigning it to the respective person.
  4. Improved communication – HealthViewX Referral Management Solution supports messaging and calling features for the referring and the receiving providers to stay connected.
  5. Data Management – The solution is HIPAA compliant and enables secure data exchange of all patient-related documents.
  6. Seamless Integration – The solution can seamlessly integrate with any EMR/EHR/RIS or Third Party application thus providing minimal disruption in the existing referral flow.
  7. Referral History Consolidation – The consolidated data regarding the referrals and the referral history of any patient can be printed as a hard copy at any time in pdf/excel.
  8. Smart Search – HealthViewX Referral Management solution has a smart search facility that helps in finding the right provider for the treatment required.
  9. Referral Data Analytics – Referral data-centric dashboard gives complete data regarding the number of referrals flowing out, the number of referrals in various status, patient follow-ups, etc.

HealthViewX Referral Management solution helps in building a secure referral network in no time. Our expert team will guide you in changing to a Patient Referral Management Software with minimal effort. Schedule a demo with us to know more about our solution.


Reference

University of California—Davis. “UC Davis study finds e-medical records have varying effects on productivity.” Dec. 2010. http://www.news.ucdavis.edu/search/news_detail.lasso?id=966

How Can Hospitals Improve Their Patient Referral Management By Complying With Meaningful Use

What is meaningful use?

Meaningful use (MU) is a health information technology (HIT) term that defines minimum U.S. government standards for

  • Using electronic health records (EHR)
  • Exchanging patient clinical data between health care providers, between health care providers and insurers, and between healthcare providers and patients

It has a set of rules known as meaningful use measures or meaningful use criteria. It determines whether or not a healthcare provider receives federal funds from the Medicare EHR Incentive Program, the Medicaid EHR Incentive Program or both.

Almost 99% of the hospitals in the U.S. use EHR systems. It is a huge leap by EHRs compared to 31% of hospitals back in 2003. EHRs are real-time, patient-centered records that make information available instantly and securely to authorized users. While an EHR does contain the medical and treatment history of patients, an EHR system is built to go beyond standard clinical data collected in a provider’s office and can be inclusive of a broader view of a patient’s care. EHRs can:

  • Contain a patient’s medical history, diagnoses, medications, treatment plans, immunization dates, allergies, radiology images, and laboratory and test results
  • Allow access to evidence-based tools that providers can use to make decisions about a patient’s care
  • Automate and streamline provider workflow

Impacts of EHR on Care

Electronic Health Records create a greater and more seamless flow of information within a digital healthcare infrastructure. It encompasses and leverages digital progress and transforms the care delivered. With EHRs, hospitals experience improved,

  • Patient Care and participation
  • Care Coordination
  • Diagnostics and Patient Outcomes
  • Practice Efficiencies and Cost Savings

Three stages of Meaningful Use (MU):

Meaningful use is divided into three stages.

Stage 1, which began in 2010, focused on promoting the adoption of EHRs.

Stage 2, finalized in late 2012, increases thresholds of criteria compliance and introduces more clinical decision support, care-coordination requirements and rudimentary patient engagement rules.

Stage 3, which the CMS is writing from late 2014 through early-to-mid 2016, will focus on robust health information exchange as well as other more fully formed meaningful use guidelines introduced in earlier stages.  

What are the incentives and penalties for meaningful use?

Under the HITECH Act enacted under the 2009 Recovery Act, incentive payments are available to eligible professionals who successfully demonstrate meaningful use of certified EHR technology.

The Recovery Act specifies three main components of meaningful use: The use of a certified EHR technology

  • In a meaningful manner
  • For electronic exchange of health information to improve quality of healthcare
  • To submit clinical quality and other measures

According to Medicare and Medicaid EHR incentive programs, the practices receive incentives if they meet the meaningful use requirements. If they do not meet the meaningful use requirements, they will be penalized.

Medicare EHR Incentive Program

Medicare incentive payments are equal to 75% of a practice’s annual Medicare Part B allowed charges up to a maximum yearly amount.

After 2015, providers who were eligible for the Medicare Meaningful Use program but did not successfully demonstrate Meaningful Use were penalized. The penalty started at 1% of Medicare Part B reimbursements and increased each year to a maximum of 5%.

Medicaid EHR Incentive Program

In the case of Medicaid patients, a practice can earn up to $63,750 in incentive payments over the six years that they choose to participate in the program.

If you start in 2015, you can earn incentives through 2020. Practices can consult their state’s agency for information about a specific payment schedule.

Providers who are eligible for Meaningful Use under the Medicaid program are not subject to payment penalties unless the provider is also eligible under the Medicare program.

How can a Patient Referral Management Referral Management enhance an EHR system to achieve meaningful use?

FQHCs prefer working with EMR/EHR systems because they are comfortable with it. So they do not wish to move out their EHR/EMR system. An EHR/EMR system has many advantages but when it is complemented with a Referral Management software practices can experience many more benefits.  

How great it would be if a Patient Referral Management software could integrate seamlessly with an EMR/EHR system? It can help in ensuring end-to-end Patient Referral Management without disturbing the existing system.

HealthViewX Patient Referral Management solution provides easy steps to integrate with a practice’s EMR/EHR system. It also enables easy and safe transferring of patient demographics, diagnostic reports, test results or any sensitive information. The solution is HIPAA-compliant with complete data security.

HealthViewX can enhance a practice’s EHR capability by making it achieve meaningful use. The practice’s scoring can also improve by using HealthViewX Patient Referral Management solution.

HealthViewX Patient Referral Management solution features

It has the following features,

  • Inbound and Outbound Referrals – HealthViewX Referral Management Solution can integrate with both the receiving and referring end. For inbound referrals, it helps in channelizing various sources into one single queue. In case of outbound referrals, it facilitates integration with the existing system to read the patient data and send out referrals.
  • Referral Timeline – Any referral has a timeline, to capture the progress of the referral. It is common to the referring and receiving provider. A referral will be mapped to a status which helps in tracking it better. For e.g. – If a patient does not show up for the appointment, the status of the referral can be changed to no-show and an appropriate reason can also be given. With the help of a referral timeline, the providers can always be aware of what is going on with the referral.
  • Workflow and Task Management – A workflow can be defined on how the referral flow must be(business rules). Providers can create tasks to manage referrals by assigning it to the respective person.
  • Improved communication – HealthViewX Referral Management Solution supports messaging and calling features for the referring and the receiving providers to stay connected.
  • Data Management – The solution is HIPAA compliant and enables secure data exchange of all patient-related documents.
  • Seamless Integration – The solution can seamlessly integrate with any EMR/EHR/RIS or Third Party application thus providing minimal disruption in the existing referral flow.
  • Referral Data Consolidation – The consolidated data regarding the referrals and the referral history of any patient can be printed as a hard copy at any time in pdf/excel.
  • Smart Search – HealthViewX Referral Management solution has a smart search facility that helps in finding the right provider for the treatment required.
  • Referral Data Analytics – Referral data-centric dashboard gives clear figures regarding the number of referrals flowing in and out, the number of referrals in various status, patient follow-ups, etc.

HealthViewX Referral Management solution helps in building a secure referral network in no time. Our expert team will guide you in changing to a Patient Referral Management Software with minimal effort. Schedule a demo with us to know more about our solution.


Reference

https://www.healthcare-informatics.com/news-item/ehr/survey-nearly-all-us-hospitals-use-ehrs-cpoe-systems