Tag Archives: patients

How to become a preferred health system for patients and referring physicians?

Healthcare technologies like telehealth, remote patient monitoring, referral management, etc., have simplified the process for health systems to deliver care for their patients. These advancements are uniquely qualified to help health systems attract patients to their facility and build their brand.  

So how do you become the preferred health system? What are the strategies behind becoming a preferred health system for your patients, and also for physicians referring patients to your health system?

Care coordination is the responsibility of any system of care and has the potential to transform healthcare delivery, improve the overall effectiveness, and efficiency of any health system. Thus, the key to becoming the preferred health system for patients is to have well-executed care coordination.

For effective care coordination, it is important to connect your entire physician community with specialists and make sure they work in unison to ensure your patients’ health needs are met and the required care is delivered.   

If care coordination is done in the right manner, it can improve health outcomes and patient experience along with the growth of the healthcare system. This way, patients, providers, and payers can get benefited. Though there are different definitions for care coordination, in the end all of them point to the same goal which is to become patients’ preferred care provider.  

Healthcare technology

Here are a few tips to become patients’ preferred health system

1. Connecting an entire network of physicians and specialists:

It is important to connect your entire set of physicians and specialists to provide quality care for each and every patient. HealthViewX end-to-end patient referral management connects your entire care network and helps you achieve this with ease.

2. Improve care coordination:

The major priority of all healthcare providers is to achieve care coordination and improve patient care but unfortunately, it still remains a challenge in the industry. The right coordinator may differ from patient to patient. Critical patient information should be readily available for all involved inpatient care. Improved care coordination results in better patient outcomes and patient satisfaction.

3. Effective communication channels and methods:

Software solutions that support upsurge communication and engagement among providers are still lacking. Manual processes (phone call, email, fax, etc.) can lead to fatigue and operational inefficiency. An end-to-end automated solution would help eliminate this challenge. One can improve the quality and continuity of care provided to patients by focusing on improving the transfer of patient information.

4. Gaining the trust of out-of-network providers/physicians:

PCPs prefer hospitals that are easy to work with. It is essential to build and maintain a strong referral base from out-of-network providers/physicians. Hospitals need to work to become a referral partner of choice for physicians and so creating a strong referral base with the referring physicians will pave the way to steady patient inflow. Hospitals should work to encourage out-of-network physicians to become more actively involved in patient care. Lack of communication can lead to poor patient health outcomes.

5. Closing the referral loop:

Planned integration of patient care between providers will help attain better service. As health systems grow more complicated, it is essential to close the referral loop for patient record and safety. The goal of referral loop closure is to track and support patients when they obtain services outside the practice. Closing the referral loop is one of the ways to become a preferred provider.

Health systems need to adopt new healthcare technologies that have the potential to improve patient care and satisfaction. One such technology that health services need to implement is patient referral management. The present referral management is complex, and coordinating care is hard for the health systems. Navigating the healthcare system or care set-ups can be tiring for patients too. Poor coordination can result in reduced quality of care, higher readmission rates, increased no-show rates, referral leakage, and higher cost of care. Better care coordination may result in more satisfied patients.

End-to-end referral tracking and follow-up is a must for effective patient care. Patient Referral Management is one such solution that can solve major challenges faced by health systems in their referral process.

Schedule a demo with HealthViewX Referral Management Solution experts today!

Patient Leakage – A major problem to hospitals and health systems

Patient leakage is a rampant problem that healthcare providers are dealing with on a day-to-day basis.  Hospitals/health systems rely on patients being referred by out-of-network physicians. 

Poorly handled or mismanaged patient referrals are a significant problem for many health systems that can lead to patient leakage and in-turn revenue loss. Patients being referred out of network is one of the main causes of patient leakage. Health systems are said to lose up to 20% of revenue due to patient leakage.

Patient Leakage – How does this happen?  

In some cases patient leakage is inevitable. For example, if a person has to be referred to any particular specialty care or treatment that is unavailable within the network then the referring provider has no choice other than referring the patient out-of-network.

Conversely, there are several other reasons where in-house providers refer patients out of their network

1. Provider Reputation

At times the provider may refer the patient out-of-network depending on the specialist availability, reputation, experience, specialist rating, and patient satisfaction. It can also be due to unavailability of that specialist within the network.  Providers are responsible for their patients’ health, so they would ensure they give the best possible treatment or reference for their patients. This is the main example of how patient leakage happens.

2. Unawareness:

New providers who have joined the health system may not be aware of all the specialists available within the care network. There are high chances that providers may refer patients out of network if they are unaware of specialists within the network. 

3. The patient chooses the specialist he/she wants:

The provider has to accommodate patient needs and ensure the patient is satisfied with the care provided. Patients’ may choose the provider based on their convenience or preferences like distance, personal preference, specialist rating, etc. Finally, the decision of choosing the specialist completely depends on the patient’s decisions. This is one of the reasons why patient leakage happens.

4. Provider-Patient Relationship:

This is also a prime reason for patient leakage. It is important that the providers build a strong relationship with their patients through quality and value-based care models and if this lacks chances are high that patient may leave the care network.

5. Distance:

Distance and location play a major role in patients opting/choosing their providers. If competing facilities are much closer than the location you refer, patients would prefer the location of their convenience. 

Do Health systems understand the amount of revenue loss?

Health systems/ large hospitals do not realize the actual amount of missed revenue due to patient leakage and missed patient appointments. Health systems have lost millions of revenue due to patient leakage and they do not properly track patient leakage. Even though health systems leaders track these leakages it is difficult for them to have a clear understanding of how to reduce this leakage or where and why it occurs in some cases.  

A lot of health systems use the EHR system to manage and track their patient referrals and EHR’s can’t show why and where the patient’s left the network. However, efficiency in tracking and managing patient referrals still remains challenging. 

HealthViewX HIPAA compliant referral management solution streamlines your end-to-end referral process and manages patient referrals better, improves patient satisfaction, reduces patient referral leakage and gives you clear insights of referral analytics for informed decisions. The best way to avoid patient leakage is to elevate patient experience and ensure you track each and every referral that comes in and goes out of network.

Schedule a demo with us and our patient referral management experts will guide you through our HIPAA compliant patient referral solution.

Referral Management Solution Is The Need Of The Hour For Large Hospitals

With the ever-evolving healthcare setting and exponential developments in health IT,  many choices need to be made by hospitals/health systems to provide their patients’ with quality care. Health systems are struggling to manage their clinical, operational and monetary challenges. Most importantly, it is necessary to orchestrate care teams’ workflow movements to be able to demonstrate meaningful use. This is the key to improving patient care and the ability to make better-informed decisions. A lot of providers are already adapting to smarter and new healthcare technologies to shape the future of healthcare.

Factors like sustainability, patient-centricity, care delivery, HIPAA compliance, digital health technology, etc. should be kept in mind before choosing any IT solution. Referral Management Solution is one such solution that is the need of the hour and it has to be chosen with utmost importance. Moving from volume-based to value-based care model will require building a solution to manage higher patient referral volumes, to ensure patients’ receive care within their referral network, track referrals, close referral loops, study dashboards and analytics for meaningful use, etc.  

There are a lot of benefits a referral management solution can bring to referring physicians, patients and receiving physicians: that includes, improved operational efficiency, reduced referral leakage, increased referral loop closures, increased revenue and patient satisfaction.

There are several other reasons why a referral management solution is required to manage patient referrals. Hospitals face numerous challenges in their referral process such as operational inefficiency, improper communication among providers, lack of coordination, missed referral loop closures, increased no-show rates, time consumption, etc.

Below are some alarming stats that show the need for a referral solution for hospitals

  • 46% of faxed referrals never result in a scheduled appointment.
  • 55% of specialist visits are unnecessary.
  • There is an annual leaked income of $900k per physician employed.
  • 50% of referring physicians do not know whether their patients actually see the specialist.

In addition, hospitals participate in passive referral management:

  1. Physician informs the patient about the need to see a specialist.
  2. Referral coordinators may not reach out to the patient to get an update to see if the patient had visited the specialist.
  3. Follow-up or update from the customer is completed only during the next visit.

Active referral management enables both provider and patient-driven processes to be managed by referral coordinators. It ensures maximum efficiency, finds the right provider for the patient, identifies referral patterns, improves stakeholder communication, reduces referral leakage, decreases lead time, improves completion rates, ensures closure of the referral loop and satisfaction of the patient.

Pitfalls in choosing the right Referral Management Solution:

Even though there are different referral management software with an array of features in the market, it often becomes frustrating to choose the right solution for your hospital. So before zeroing in on the solution, a detailed analysis of your current challenges in the patient referral process has to be carried out. Later mapping to the required features of the solution will be the best choice.

Health Systems need an end-to-end interoperable referral solution to track their patient referrals throughout the process until the referral loop closure. The solution should streamline and enable seamless communication among all stakeholders’ involved in-patient care.

Some of the benefits you can see when using patient referral software are

For the providers:

  • Reduce referral leakage and improved operational efficiency
  • Seamless communication
  • Multi-channel integration
  • Manage and track referrals
  • Meaningful engagement
  • Effective diagnosis and treatment

For the patients:

  • Prompt diagnosis
  • Save time and money
  • Better outcome

HealthViewX Referral Management Solution was created with the potential to solve all the challenges faced by enterprise hospitals in their referral process.

HealthViewX Referral Management Solution helps to send and receive referrals securely and seamlessly, provide quick access to patient data, fix appointments, send notifications and alerts, and share information throughout to ensure closure of referral loop. A 30-minute demo with our team will help you know how effective our solution can track and manage the referral life cycle. To know more schedule a demo with us.

FQHC Statistics – Growth, Region, Performance and Revenue – Federally Qualified Health Centers across the USA

What are Federally Qualified Health Centers (FQHCs)?

Federally Qualified Health Centers (FQHCs) in the United States are non-profit entities that are composed of clinical care providers, who operate at comprehensive federal standards. FQHCs were originally intended to provide the medically underserved population with quality care to minimize patient load in hospital emergency rooms.

According to Medicare and Medicaid statutes, FQHCs receive federal funding under Section 330 of the Public Health Service (PHS) Act to provide comprehensive primary care services to uninsured and underinsured populations thus ensuring that comprehensive care is available to all, regardless of income or insurance status. Medicare pays FQHCs based on the FQHC Prospective Payment System (PPS) for medically necessary primary health services and qualified preventive health services given by an FQHC practitioner.

To receive federal funding, FQHCs must meet the following requirements:

  • Be located in a federally designated medically underserved area (MUA) or serve medically underserved populations (MUP)
  • Provide comprehensive primary care
  • Adjust charges for health services on a sliding fee schedule according to patient income
  • Be governed by a community board of which a majority of members are patients at the FQHC

The Growth of FQHCs

In the early 1960s, there were only 8 health centers in the U.S. Ever since then, the numbers have increased exponentially. By 2001, there were 748 health centers at 4,128 service sites around the nation, serving approximately 10 million individuals.

Federal funding for health centers has increased from $750 million in 1996 to $2.2 billion in 2010. Federal support has increased tremendously over the last 10 years. In 2011, there were 1,128 health centers providing care to more than 8,000 rural and urban delivery sites in the U.S. and territories. Today, there are 1,400 organizations with 11,200 facilities serving about 25 million individuals every year.

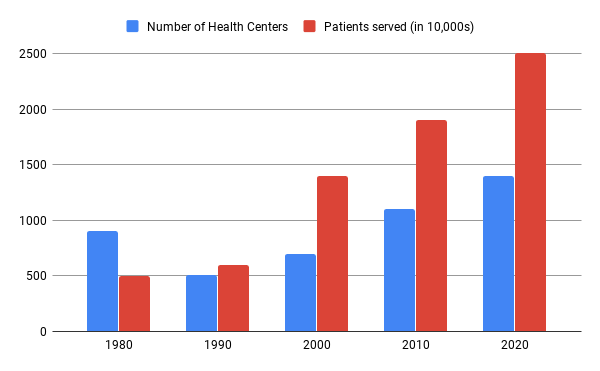
The above chart shows the growth of health centers from its inception in 1980 till 2020. The chart also shows the exponential increase in the number of patients served over the years.

FQHCs in various regions across the U.S

State State Code Number of FQHCs
California CA 178
Texas TX 73
New York NY 70
Florida FL 48
Ohio OH 47
Illinois IL 45
Pennsylvania PA 44
North Carolina NC 40
Michigan MI 39
Massachusetts MA 39
Georgia GA 35
Louisiana LA 36
Oregon OR 33
West Virginia WV 31
Tennessee TN 30
Alaska AK 28
Missouri MO 28
Washington WA 27
Virginia VA 26
Indiana IN 25
Kentucky KY 23
New Jersey NJ 23
South Carolina SC 23
Arizona AZ 21
Mississippi MS 21
Colorado CO 21
Oklahoma OK 20
Maine ME 20
Kansas KA 18
Maryland MD 17
Montana MT 17
New Mexico NM 17
Wisconsin WI 18
Connecticut CT 17
Minnesota MN 16
Alabama AL 15
Hawaii HI 14
Iowa IA 14
Idaho ID 14
Puerto Rico PR 14
Utah UT 13
Arkansas AR 12
New Hampshire NH 11
Vermont VT 11
District of Columbia WDC 8
Rhode Island RI 8
Nebraska NE 7
Nevada NV 7
Wyoming WY 6
South Dakota SD 5
North Dakota ND 4
Delaware DE 3
Virgin Islands VI 3
Guam GU 2
Northern Mariana Islands MP 2

Performance of FQHCs

Figure 2 - Health Centers Perform Better on Ambulatory Care Quality Measures than Private Practice Physicians

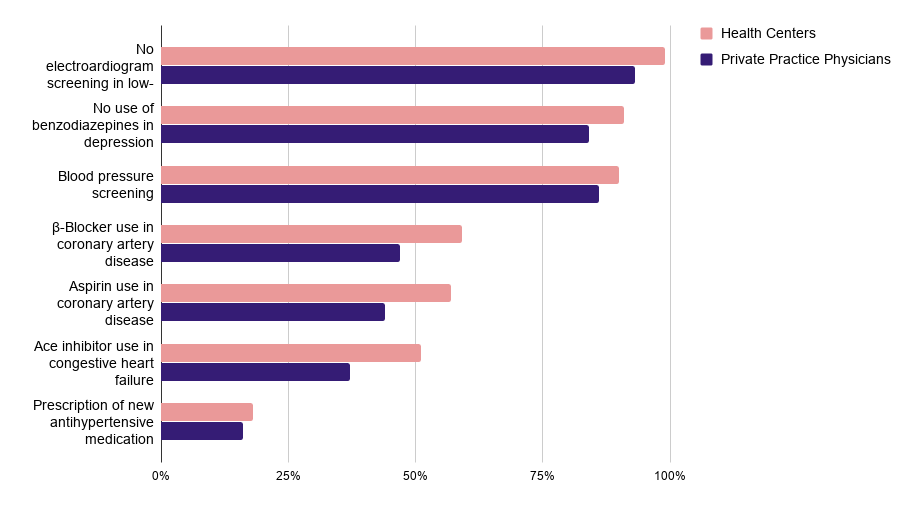
Figure 2 – Health Centers Perform Better on Ambulatory Care Quality Measures than Private Practice Physicians

The above chart shows how health centers have outperformed private practice physicians in every aspect of service.

Figure 3 - Health Centers Provide More Preventive Services than Other Primary Care Providers

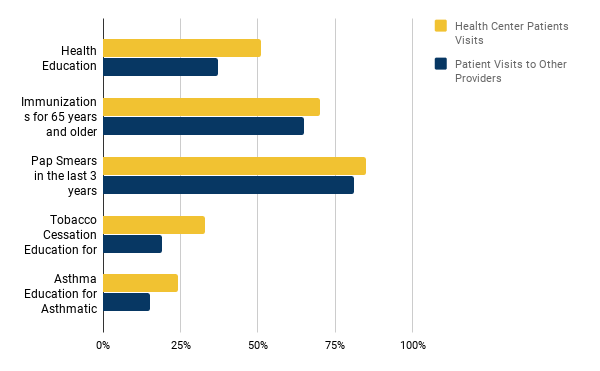
Figure 3 – Health Centers Provide More Preventive Services than Other Primary Care Providers

The above chart shows a comparison between health centers and other providers based on the number of patient visits for various ailments.

Figure 4 - Health Center Patients Are More Satisfied with the Overall Care Received Compared with Low Income Patients Nationally

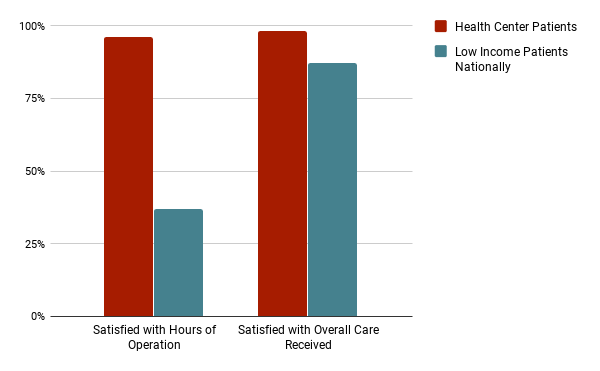
Figure 4 – Health Center Patients Are More Satisfied with the Overall Care Received Compared with Low Income Patients Nationally

The above chart shows the level of satisfaction of low-income patients. Health center patients have a huge level of satisfaction as compared to other low-income patients nationally.

Financing and Reimbursements for FQHCs

FQHCs are required by law to provide services to all people, regardless of ability to pay. The uninsured are charged for services on a board-approved sliding-fee scale, which is based on a patient’s family income and size.

FQHCs are financed through various methods. These include a mix of Medicaid and Medicare reimbursements (with different payment methodologies), direct patient revenue, other third-party payers (private insurers), state funding, local funding, philanthropic organizations, and grant funding from the Bureau of Primary Health Care (BPHC) of HRSA of the U.S. Department of Health and Human Services (HHS).

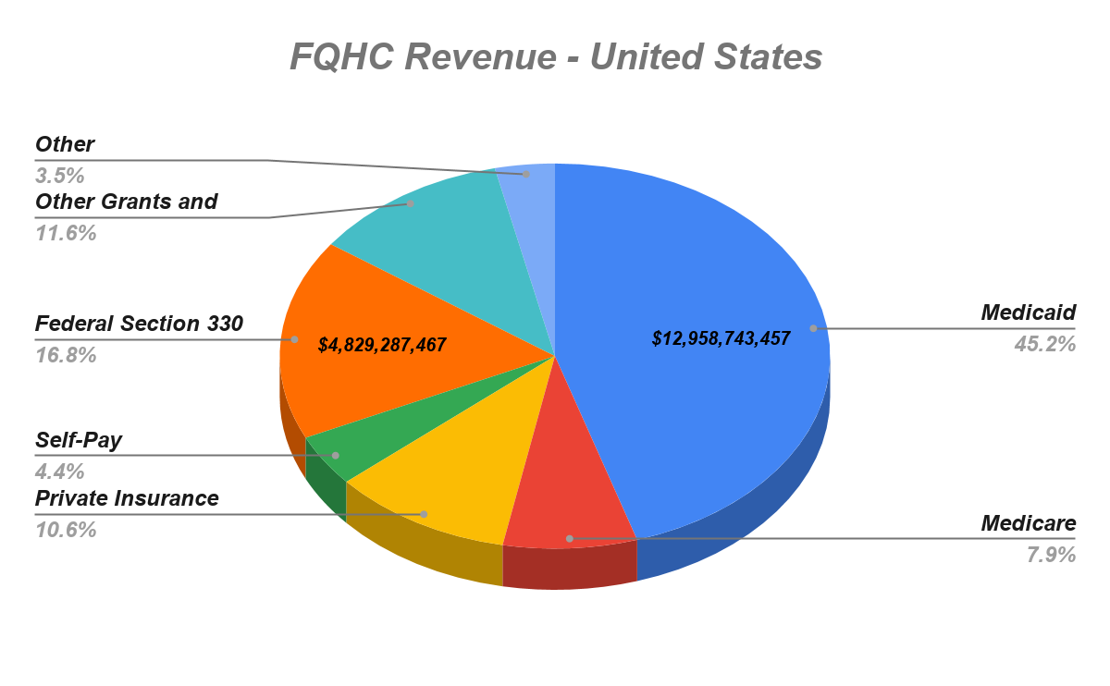
The above chart shows the revenue distribution of FQHCs based on payer source (2018).

FQHC Revenue across all regions in the U.S (approx. 2018)

Source:
George Washington University analysis of the Health Resources and Services Administration’s Uniform Data System. Special Data Request, September 2019.

Location Medicaid Medicare Private Insurance Self-Pay Federal Section 330 Grants Other Grants and Contracts Other Total
United States $12,958,743,457 $2,260,247,981 $3,048,512,406 $1,248,741,884 $4,829,287,467 $3,336,624,219 $1,007,447,180 $28,689,604,594
Alabama $52,785,795 $17,803,287 $17,114,860 $12,744,350 $83,625,546 $13,471,556 $4,344,085 $201,889,479
Alaska $102,348,854 $18,671,815 $37,698,230 $6,477,465 $67,692,068 $119,544,705 $2,756,393 $355,189,530
Arizona $337,972,854 $47,634,000 $71,949,881 $23,395,361 $83,428,217 $41,485,739 $5,472,766 $611,338,818
Arkansas $62,148,511 $24,046,228 $30,622,521 $12,429,111 $54,555,352 $9,120,521 $1,735,385 $194,657,629
California $3,704,343,504 $411,514,109 $291,192,054 $148,976,225 $658,760,061 $615,047,232 $334,581,140 $6,164,414,325
Colorado $319,775,816 $39,134,784 $48,657,089 $30,779,398 $106,101,957 $95,942,011 $20,709,084 $661,100,139
Connecticut $228,434,332 $32,127,164 $26,544,878 $11,568,619 $59,696,129 $50,791,682 $10,598,421 $419,761,225
Delaware $11,773,644 $1,479,685 $2,463,464 $4,386,233 $13,557,989 $5,219,063 $470,309 $39,350,387
District of Columbia $160,105,430 $22,175,379 $32,105,709 $5,512,030 $27,476,019 $31,943,055 $7,236,844 $286,554,466
Florida $391,497,340 $60,674,510 $209,954,679 $81,714,253 $236,911,216 $193,834,424 $17,832,728 $1,192,419,150
Georgia $66,177,853 $48,142,417 $57,295,748 $30,758,262 $117,787,006 $28,848,026 $9,877,675 $358,886,987
Hawaii $107,408,992 $15,806,563 $17,253,126 $5,783,071 $31,398,131 $32,520,603 $3,907,118 $214,077,604
Idaho $45,572,373 $21,289,644 $50,122,229 $22,535,206 $45,993,298 $25,577,164 $3,267,335 $214,357,249
Illinois $455,197,448 $56,238,990 $131,100,822 $64,116,380 $201,027,383 $137,469,419 $29,398,121 $1,074,548,563
Indiana $200,004,374 $20,647,447 $30,284,051 $18,433,251 $75,547,860 $28,756,217 $30,759,622 $404,432,822
Iowa $83,853,103 $13,542,737 $23,553,367 $12,655,645 $38,528,294 $19,319,034 $1,624,245 $193,076,425
Kansas $37,808,462 $19,789,301 $26,840,099 $15,221,728 $44,761,541 $16,668,896 $4,665,564 $165,755,591
Kentucky $176,573,940 $46,631,367 $68,598,016 $24,819,874 $80,881,354 $6,773,516 $6,597,845 $410,875,912
Louisiana $146,815,697 $31,043,111 $59,995,751 $11,587,230 $100,474,957 $30,961,276 $4,441,509 $385,319,531
Maine $41,882,541 $35,423,228 $47,436,524 $12,099,407 $43,787,648 $11,360,335 $6,280,495 $198,270,178
Maryland $150,688,381 $29,260,626 $73,964,146 $13,146,680 $57,449,364 $35,657,860 $21,090,583 $381,257,640
Massachusetts $362,280,706 $103,012,238 $165,134,454 $27,248,100 $128,238,080 $258,007,270 $160,820,426 $1,204,741,274
Michigan $314,285,715 $68,214,766 $79,638,020 $28,291,497 $127,807,919 $44,375,118 $9,855,849 $672,468,884
Minnesota $75,452,268 $12,577,519 $16,837,190 $11,935,453 $42,977,632 $29,987,097 $4,128,981 $193,896,140
Mississippi $32,037,428 $18,436,338 $22,813,575 $21,440,111 $74,626,865 $14,886,816 $1,657,237 $185,898,370
Missouri $255,311,813 $26,546,831 $59,184,521 $28,003,100 $110,804,809 $33,834,797 $10,235,337 $523,921,208
Montana $34,073,242 $12,203,723 $17,685,163 $7,521,912 $42,126,575 $10,185,208 $6,307,871 $130,103,694
Nebraska $19,899,828 $1,982,820 $13,342,672 $7,991,555 $22,106,057 $22,906,355 $1,933,464 $90,162,751
Nevada $33,773,688 $11,166,606 $12,531,690 $3,172,460 $21,069,529 $15,948,721 $706,509 $98,369,203
New Hampshire $21,695,854 $17,132,960 $22,653,425 $5,099,829 $24,039,213 $11,899,812 $2,725,189 $105,246,282
New Jersey $158,938,887 $11,758,143 $14,145,131 $21,606,309 $81,666,571 $69,281,662 $5,982,249 $363,378,952
New Mexico $132,429,129 $26,364,684 $24,132,532 $15,923,683 $76,523,082 $57,190,428 $4,530,396 $337,093,934
New York $1,461,356,192 $201,623,297 $250,926,163 $50,171,017 $269,626,284 $385,124,022 $91,523,863 $2,710,350,838
North Carolina $90,190,949 $59,012,065 $65,516,943 $50,837,624 $133,899,942 $40,248,341 $26,574,283 $466,280,147
North Dakota $11,640,795 $3,863,326 $9,419,592 $4,474,860 $10,746,019 $908,251 $1,001,661 $42,054,504
Ohio $261,827,729 $51,042,970 $58,596,828 $25,007,037 $146,210,064 $41,839,517 $21,051,011 $605,575,156
Oklahoma $58,934,312 $20,089,581 $28,480,968 $19,992,107 $58,679,531 $10,582,038 $2,883,612 $199,642,149
Oregon $394,118,738 $51,503,384 $31,974,615 $15,310,703 $91,700,505 $91,028,195 $7,602,558 $683,238,698
Pennsylvania $315,531,242 $68,519,997 $104,374,387 $17,072,987 $128,243,325 $37,490,171 $10,326,309 $681,558,418
Rhode Island $109,670,334 $15,761,096 $19,797,174 $5,830,348 $28,040,434 $14,890,907 $4,960,361 $198,950,654
South Carolina $95,328,346 $89,583,350 $103,316,045 $25,145,381 $89,314,251 $31,444,029 $18,322,528 $452,453,930
South Dakota $11,514,028 $4,903,220 $10,207,221 $6,525,886 $17,900,812 $3,435,235 $1,231,547 $55,717,949
Tennessee $80,779,671 $26,920,974 $41,375,639 $15,091,806 $87,348,642 $31,856,403 $3,747,729 $287,120,864
Texas $405,350,935 $68,050,313 $170,985,325 $92,159,958 $258,162,160 $309,998,557 $26,687,781 $1,331,395,029
Utah $29,700,875 $11,520,256 $16,681,038 $13,794,751 $39,878,950 $24,880,704 $3,574,692 $140,031,266
Vermont $47,210,527 $31,973,872 $34,695,192 $23,137,643 $23,463,366 $7,348,657 $8,511,984 $176,341,241
Virginia $54,549,880 $39,744,588 $42,438,653 $26,005,991 $85,805,735 $20,677,091 $4,357,021 $273,578,959
Washington $769,937,162 $89,428,910 $129,151,433 $58,320,292 $139,027,744 $94,896,347 $14,596,022 $1,295,357,910
West Virginia $116,781,516 $57,847,408 $83,808,357 $28,402,025 $68,591,429 $16,910,711 $12,143,151 $384,484,597
Wisconsin $149,327,704 $8,202,250 $27,257,452 $10,451,845 $45,790,614 $27,262,928 $7,630,433 $275,923,226
Wyoming $6,918,264 $4,226,082 $5,490,411 $3,411,365 $7,478,734 $1,763,502 $477,559 $29,765,917
American Samoa $786,753 $0 $0 $0 $3,082,370 $0 $0 $3,869,123
Federated States of Micronesia $0 $0 $24,112 $84,319 $3,186,592 $0 $0 $3,295,023
Guam $2,451,828 $53,941 $17,002 $132,489 $2,173,874 $2,330,520 $137,227 $7,296,881
Marshall Islands $0 $0 $0 $31,865 $1,061,772 $1,086,917 $0 $2,180,554
Northern Mariana Islands $98,987 $641 $7,161 $11,185 $677,559 $0 $122,655 $918,188
Palau $0 $0 $259,006 $1,461,345 $940,810 $50,000 $0 $2,711,161
Puerto Rico $153,566,707 $33,237,486 $10,276,689 $7,922,019 $103,150,074 $16,880,374 $3,452,418 $328,485,767
U.S. Virgin Islands $7,822,181 $665,954 $589,383 $581,248 $3,678,153 $4,875,184 $0 $18,212,103

Definitions:
*Medicaid*: also includes the Children’s Health Insurance Program (CHIP), family planning programs, and state-funded coverage programs.

*Private Insurance*: includes employer-sponsored insurance and insurance purchased in the individual market (including the Marketplaces).

*Federal Section 330 Grants*: grants provided by the Health Services Resources Administration, Bureau of Primary Health Care under Section 330 of the Public Health Service Act.

*Other Grants and Contracts*: includes federal grants other than Section 330 grants, grants from state and local governments and private foundations, payments from state and local indigent care programs, and contracts.

*Other*: includes non-patient related revenue, such as fundraising, interest income, rent from tentants, etc.

Future of FQHCs

FQHCs have had significant growth in the past decades. The statistical data indicates that FQHCs have the potential to serve more patients by improving the quality of care. To provide quality care and improve patient experience, FQHCs must invest in the right technology like HealthViewX Care Orchestration Platform which provides the best solutions for the major challenges faced by the health centers.

Reference:

  1. https://www.cms.gov/Outreach-and-Education/Medicare-Learning-Network-MLN/MLNProducts/Downloads/fqhcfactsheet.pdf
  2. Kaiser Commission on Medicaid and the Uninsured (data from the National Association of Community Health Centers and the Uniform Data System (UDS) of the Health Resources and Services Administration (HRSA).
  3. Goldman, LE et al. Federally Qualified Health Centers and Private Practice Performance on Ambulatory Care Measures. American Journal of Preventive Medicine. 2012. 43(2):142-149. *Fontil et al. Management of Hypertension in Primary Care Safety-Net Clinics in the United States: A Comparison of Community Health Centers and Private Physicians’ Offices. Health Services Research. April 2017. 52:2.
  4. 2015 Uniform Data System. Bureau of Primary Health Care, HRSA, DHHS. National Center for Health Statistics. NCHS Data Brief. No. 220. November 2015. Hypertension Prevalence and Control Among Adults: United States, 2011 – 2014. National Committee for Quality Assurance. Comprehensive Diabetes Care, The State of Healthcare Quality (2016).
  5. Shi L, Tsai J, Higgins PC, Lebrun La. (2009). Racial/ethnic and socioeconomic disparities in access to care and quality of care for US health center patients compared with non-health center patients. J Ambul Care Manage 32(4): 342 – 50. Shi L, Leburn L, Tsai J and Zhu J. (2010). Characteristics of Ambulatory Care Patients and Services: A Comparison of Community Health Centers and Physicians’ Offices J Health Care for Poor and Underserved 21 (4): 1169-83. Hing E, Hooker RS, Ashman JJ. (2010). Primary Health Care in Community Health Centers and Comparison with Office-Based Practice. J Community Health. 2011 Jun; 36(3): 406 – 13.
  6. Shi L, Lebrun-Harris LA, Daly CA, et al. Reducing Disparities in Access to Primary Care and Patient Satisfaction with Care: The Role of Health Centers. Journal of Health Care for the Poor and Underserved. 2013; 24(1):56-66.
  7. George Washington University analysis of the Health Resources and Services Administration’s Uniform Data System. Special Data Request, March 2018.
  8. Community Health Center Revenues by Payer Source.

How Can A Patient Referral Management Software Help Federally Qualified Health Centers In Solving The Opioid Crisis?

What are opioids?

Opioids are a drug class that includes the illegal drug heroin as well as powerful pain relievers, such as

  • Oxycodone
  • Hydrocodone
  • Codeine
  • Morphine
  • Fentanyl

and many others.

Why is there an opioid overdose crisis in USA?

In the late 1990s, pharmaceutical companies reassured the medical community that patients would not become addicted to opioid pain relievers. So healthcare providers began to prescribe them at greater rates. Increased prescription of opioid medications led to widespread misuse of both prescription and non-prescription opioids. It all happened even before it became clear that these medications could indeed be highly addictive.

How has the opioid crisis affected the American population?

  • In 2016, more than 42,000 people died from overdoses involving opioids. About 40% of all opioid overdose deaths were because of prescriptions.
  • Every day in the U.S., hospitals treat more than 1,000 people in emergency departments for not using prescription opioids as directed.
  • On an average, 115 Americans die every day from an opioid overdose.
  • Roughly 21 to 29% of patients prescribed opioids for chronic pain misuse them.
  • Between 8 and 12% develop an opioid use disorder.
  • An estimated 4 to 6% who misuse prescription opioids transition to heroin.
  • About 80% of people who use heroin first misused prescription opioids.
  • Opioid overdoses increased 30% from July 2016 through September 2017 in 52 areas in 45 states.
  • The Midwestern region saw opioid overdoses increase 70% from July 2016 through September 2017.
  • Opioid overdoses in large cities increased by 54% in 16 states

Drug overdose is now the leading cause of accidental death in the U.S., and opioid addiction is driving this epidemic.

What are the measures taken up by the U.S. Department of Health and Human Services (HHS)?

In response to the opioid crisis, HHS is focusing its efforts on five major priorities:

  • Improving access to treatment and recovery services
  • Promoting the use of overdose-reversing drugs
  • Strengthening our understanding of the epidemic through better public health surveillance
  • Providing support for cutting-edge research on pain and addiction
  • Advancing better practices for pain management

How does the opioid crisis impact Federally Qualified Health Centers (FQHCs)?

Federally Qualified Health Center (FQHC) in the United States is a non-profit entity consisting of clinical care providers, that work at comprehensive federal standards. FQHC is a dominant model for providing integrated primary care and public health services to low-income and underserved population. To receive federal funding, FQHCs must meet the following requirements.

  • Be in a federally designated medically underserved area (MUA) or serve medically underserved populations (MUP)
  • Provide comprehensive primary care
  • Adjust charges for health services on a sliding fee schedule according to patient income
  • Be governed by a community board of which most of the members are patients at the FQHC

The opioid crisis is taking a hit at FQHCs because it is affecting the poorer population to a greater extent. The underserved population is more affected by this crisis because they are not able to give up on opioids even when they cannot afford it. When such patients visit an FQHC, the physicians must refer them to deaddiction centers or rehabilitation centers for treatment. Considering the increasing number of opioid addicts, the number of patients visiting FQHCs will also be more. This implies that FQHCs have to create more referrals every day. FQHCs are finding it difficult to handle such a huge number of referrals.

Challenges faced by FQHCs

  • Prior Authorization – The referral coordinator does the insurance pre-authorization for the patient referrals in healthcare. Considering that physicians refer one out of every three patients to a specialist, it is difficult to do prior authorization. This makes patient referral system time-consuming and ineffective.
  • Finding the right specialist/imaging center – There is no effective approach to finding the right specialist/imaging center. So the chances of missing out on a good specialist/imaging center are high. The list of imaging centers and specialists an FQHC has will not be up-to-date as new specialists and imaging centers are opening up often.
  • Open Referral loops – This happens when the receiving provider fails to update the progress of the referral. 25% to 50% of referring physicians do not know if their patients actually visit the specialist or imaging center. As many patient referrals are initiated on a daily basis, tracking it manually is difficult for the referring provider. This ultimately results in an open patient referral loop.
  • Patient referral leakage –  When a patient moves out of the network, it results in patient referral leakage. It has an effect on the revenue. The main problem with this is the missed revenue opportunities for health systems. These organizations miss out on reimbursement for medical services that they had provided earlier when patient leakage occurs. This applies to healthcare systems that adopt value-based care or payment models such as accountable care organizations (ACOs).
  • Outdated referral workflow – The current referral workflow is outdated. The providers find it difficult to cope up with the increasing patient referrals in healthcare. On an average, a referring provider spends half an hour to one hour per referral and even more time in following up.

How can HealthViewX Patient Referral Management solution help FQHCs?

A typical FQHC does a lot of outbound referrals where the PCP’s refers his patient to a specialist practice when the patient needs expert advice or advanced treatment for a specific problem. The PCP generates a referral request with the EHR system to a central team that has referral coordinators. The patient’s insurance is pre-authorized, the physician refers the patient is to a specialist or imaging center. This is how a referral works. It involves a lot of manual work and keeping track of the referral is highly impossible because a referral coordinator deals with thousands of these in a day.

This is when an automated Healthcare Patient Referral Management System comes in handy. Electronic healthcare referral management system helps healthcare organizations in the seamless processing of the referral process.

HealthViewX solution has implemented a referral consolidator that brings all the referrals in a single queue. The referral coordinator can validate the documents, attach new ones, merge it to an existing referral, create a new referral for it etc. The feature also lets the referral coordinator validate the patient insurance eligibility. Based on the specialist availability the referral coordinator can create a referral. The system can integrate with EMR/EHR and can also coordinate between the referring and the receiving sides. A referral has a status attached to it looking at which the referring provider can understand in what stage the referral is. Any referral has a timeline view which is common to both the receiving and the referring providers. In the timeline view history of the referral can be seen for eg: patiently related notes, previous status of the referral, etc. Documents attachment and status change can also be done at any time of the referral process. With the help of HealthViewX Patient Referral Management solution, the referring and the receiving provider can always have an eye on the referral and also close it in time.

HealthViewX Patient Referral Management Solution features

  • Insurance Pre-authorization – HealthViewX solution supports automated insurance pre-authorization that reduces the manual work of the referral coordinators.
  • Intelligent Provider Match – The solution supports an “Intelligent Provider Match” Feature that helps in finding the right specialist/imaging center easily.
  • Seamless communication – HealthViewX solution has an inbuilt audio calling and messaging application which is secure and enables faster communication
  • HIPAA compliant data security – The solution is HIPAA compliant and offers secure data exchange. It supports almost all formats of files and keeps the patient documents safe.
  • Referral history – The timeline view provides the history and current status of the referral. A status helps in knowing the referral progress.
  • Referral loop closure – Referral updates are hard to miss that makes it easier to close the referral loops on time.

HealthViewX Patient Referral Management application solves most of the outbound referral problems for FQHCs. To know more about HealthViewX solution, schedule a demo with us. Our patient referral management experts will guide you through our HIPAA-compliant solution.

References

What Are The Requirements To Start Chronic Care Management Program For Your Practice?

Medicare Chronic Care Management program

More than 45% of the American population is suffering from at least one chronic condition. CMS had an insurance policy to reimburse the hospital expenses of chronic patients. Due to inefficient care, the patients were readmitted to the hospital. This, in turn, increased the Medicare reimbursements. Medicare identified the need for continued care to patients with chronic conditions. In order to cut down on insurance expenses and provide continuous care to patients, Medicare introduced the Chronic Care Management (CCM) program.

In 2015, Medicare introduced the Chronic Care Management (CCM) program. It is defined as non-face-to-face services provided to its beneficiaries. In addition to office visits and other face-to-face encounters (billed separately), these services include

  • Communication with the patient
  • Health professionals being available both electronically and by phone for care coordination, medication management, and being accessible to patients.

Medicare provides Chronic Care Management services for patients with multiple (two or more) chronic conditions

  • Expected to last at least 12 months or until the death of the patient.
  • Places the patient at significant risk of death, acute exacerbation/ decompensation, or functional decline.

CCM Service Summary

The following are steps through which a Chronic Care Management service is furnished,

  1. Initiating Visit  Initiation during an Annual Wellness Visit (AWV), Initial Preventive Physical Examination (IPPE) or face-to-face E/M visit for new patients or patients not seen within one year prior to the commencement of Chronic Care Management services.
  2. Structured Recording of Patient Information Using Certified EHR Technology –  Structured recording of demographics, problems, medications, and medication allergies using certified EHR technology.
  3. 24/7 Access & Continuity of Care – Provide 24/7 access to physicians or other qualified healthcare professionals or clinical staff and continuity of care with a designated member of the care team.
  4. Comprehensive Care Plan – Creation, revision, and/or monitoring of an electronic person-centered care plan.
  5. Enhanced Communication Opportunities – Enhanced opportunities for the patient to communicate with the physician through not only telephone access, but also the use of secure messaging, Internet, or other non-face-to-face consultation methods.

Why Chronic Care Management?

Most practices have a large population of patients with two or more chronic conditions. In fact, 68% of Medicare patients fit this description. The goal of a practice is to help their patients get healthier and improve their overall standard of living. This can be tough in case of chronic patients who require significant additional support. The practice may not have the resources to provide care. Without the proper systems in place, treating patients with chronic conditions is difficult to manage. That’s when the Chronic Care Management (CCM) program comes to play.

CPT codes for CCM

99490 $42 CCM services for at least 20 minutes of clinical staff time directed by a physician or other qualified healthcare professional per calendar month
99487 $60 CCM services for at least 60 minutes of clinical staff time directed by a physician or other qualified healthcare professional per calendar month
99489 $47 Each additional 30 minutes of clinical staff time directed by a physician or qualified healthcare professional per calendar month.

Chronic Care Program Requirements

One of the biggest obstacles that prevent medical practices from engaging in these programs are the inherent requirements for Medicare reimbursement. Some of these requirements include:

  • An established care team
  • A thorough care plan
  • 24/7 access to clinical staff
  • Coordination with clinical providers
  • 20+ monthly minutes of non-face-to-face care coordination

Partnering with CCM

With the available finite resources, the practice can partner with CCM services. Chronic Care Management services have the following advantages,

  • Good Medicare reimbursements depending on the service given
  • Ability to provide care and support to the patients for managing their conditions better
  • No additional cost if billing is managed within the network.

HealthViewX Chronic Care Management solution features

As the requirements of Chronic Care Management program are more, practices face difficulty in meeting the requirements. HealthViewX Chronic Care Management solution supports the following features that simplify the process,

  • Inbuilt audio, video calling and messaging features – HealthViewX Chronic Care Management solution has inbuilt video and audio calling features. It helps in giving Chronic Care Management services to their patients. Secure messaging is also available through which the physicians and the patients can communicate.
  • Automated call log feature – After a patient call, care plan creation or any action related to Chronic Care Management services, call logs are added to the patient. It reduces the physician’s manual effort is logging the call logs.
  • Preventive Care plans – HealthViewX solution supports care plans for the Chronic Care Management service for a patient. The physician can create a care plan depending on the patient’s health report. It helps in monitoring the patient’s vitals.
  • Chronic Care Management Analytics – Dashboards with intuitive charts and tables give complete analytics of the Chronic Care Management services. It provides a clear picture of the revenue perspective.
  • Consolidated Report – The physician can generate a consolidated report of the Chronic Care Management services given for a particular period. This makes it easy for the billing practitioner for getting the Medicare reimbursements.
  • HIPAA compliance – HealthViewX Chronic Care Management is HIPAA-compliant. It facilitates secure data exchange. All patient-related documents are managed securely.

HealthViewX Chronic Care Management solution is on par with the current requirements. It helps the practice to set up a CCM program with the least investment. To know more about our Chronic Care Management solution, schedule a demo with us.


References

  1. www.fightchronicdisease.org/sites/default/files/docs/Almanac_FINAL.ppt